Genomic Testing & Selection Resources for Beef Cattle
Fact Sheets
Brief guides for collecting tissue, hair, and blood samples for genetic testing in beef cattle, and interpreting results from genetic tests.
Sample Collection Guide
Methods for Sample Collection

Tissue Sampling Units (TSUs)
This sampling procedure can be combined with tagging, when the sample is taken at the same time as the tag is inserted into the ear.
TSUs can be stored at room temperature in a cool, dry place before shipping at room temperature.
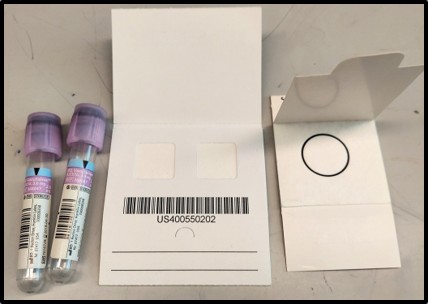
Whole Blood and Blood Cards
Blood can also be spotted onto a FTA blood card covering the entire circle or square on the card, and be sure to let the card dry before storing in a cool, dry place.
Blood cards can be shipped at room temperature.
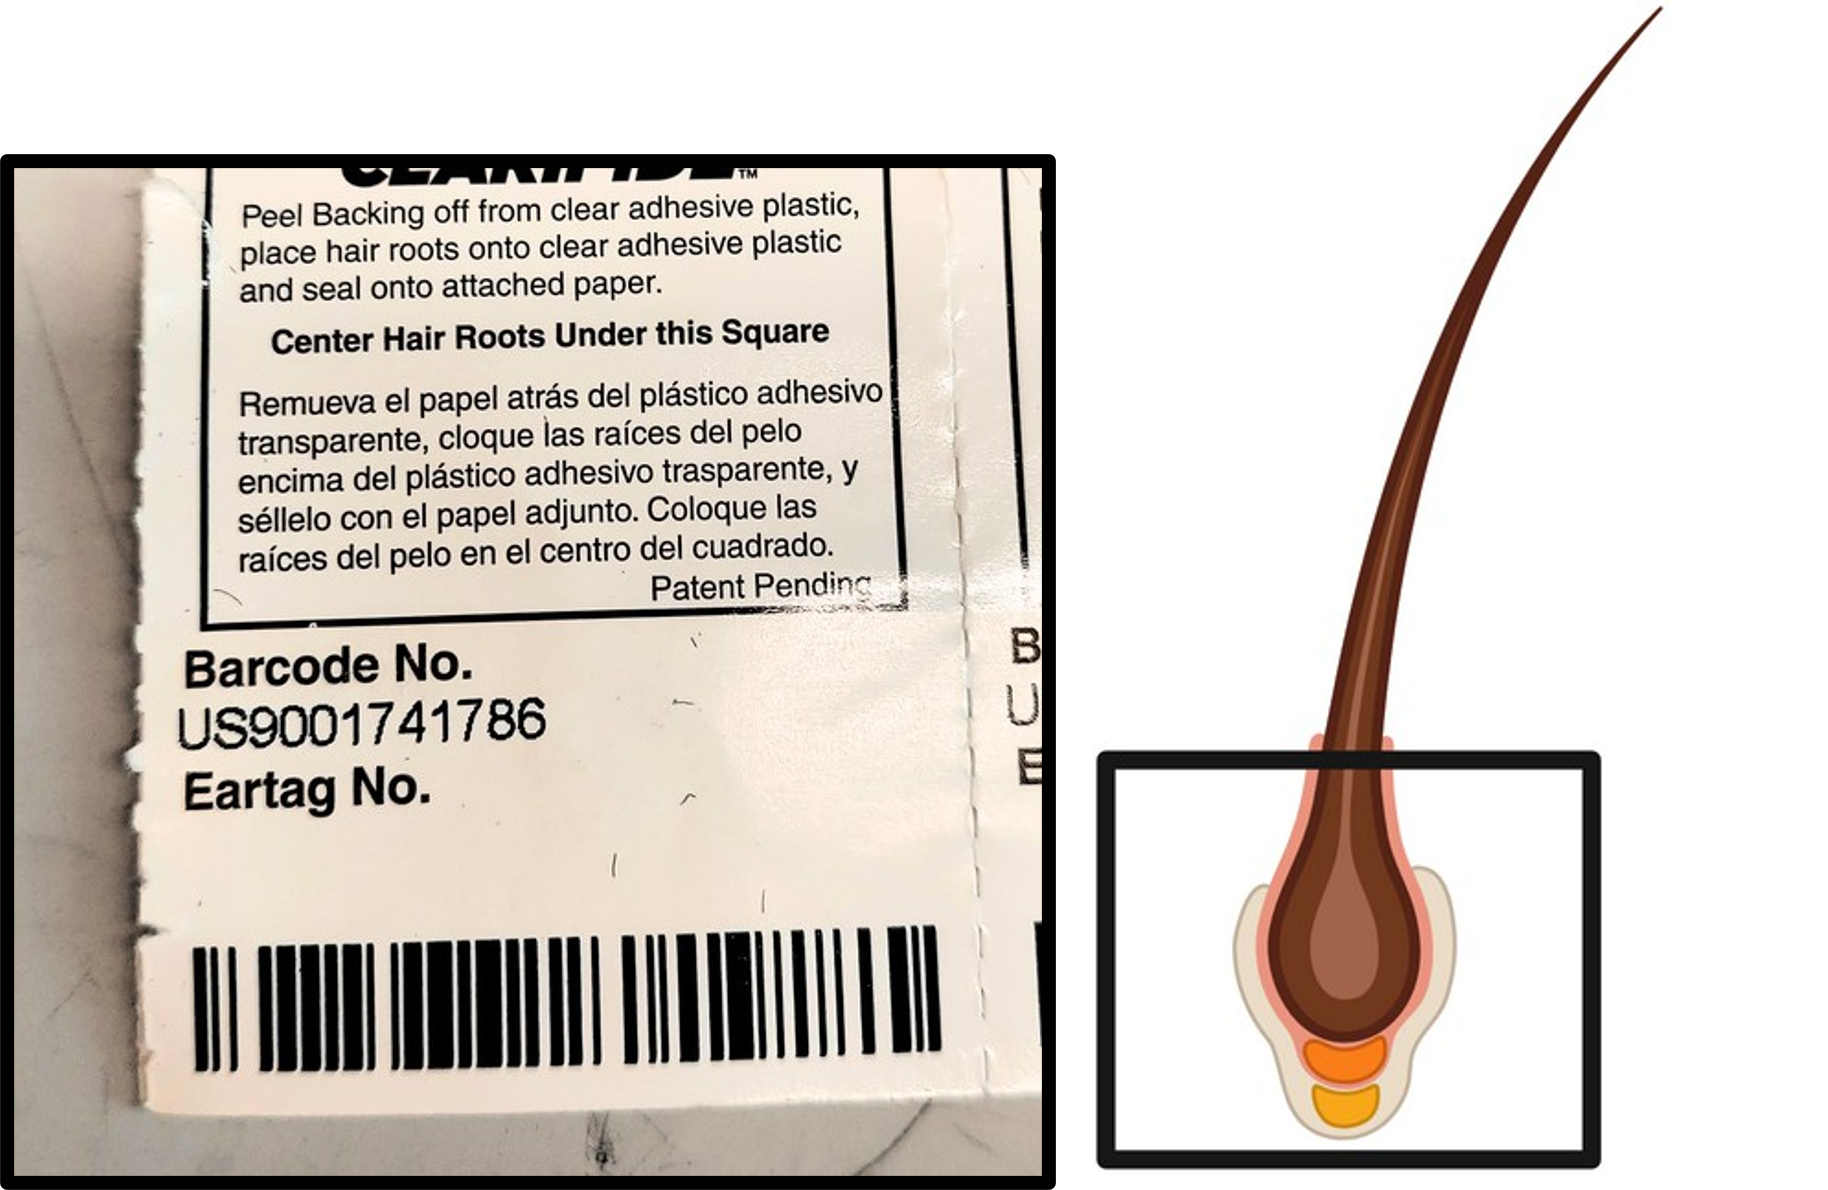
Hair Bulbs
Next, use a clean tool such as pliers to pull 20-30 hairs (about width of a pencil) from the tail switch, poll, or neck area. Make sure to get the hair bulbs or roots, as these contain the DNA. Hair can be stored in a cool, dry location and shipped at room temperature.
Sampling Tips
Keep detailed and clear records during sampling to prevent duplicated or skipped animals. Make sure samples are not contaminated with manure, dirt, and debris.
Clean sampling tools between animals to prevent cross-contamination of DNA.
Store samples out of sunlight and heat, and ship accordingly to prevent DNA degradation.
Genomic Testing in Beef Cattle at a Glance
Parentage
Sire and dam IDs are matched and directly reported with offspring IDs, such as listed in the table below:
| Animal ID | Sire ID | Dam ID |
| 12345 | A123 | 00123 |
| 12346 | H456 | 00124 |
Single-Gene Tests
Single-gene or single-SNP tests are reported as a genotype represented by a number (0,0 or 0,1 etc.) or letters H/H, H/h, or h/h for polled/horned). An example is listed in the table below:
| Animal ID | Genotype |
| 12345 | H/H |
| 12346 | H/h |
| 12347 | h/h |
| 12348 | h/h |
Genomic Expected Progeny Differences (GEPDs)
Values are often reported as an animal’s deviation from the breed mean (+/-), which is not necessarily 0. An example is shown in the table below
Accuracy (ACC) is how likely the prediction is to match the true value, which increases with more information from progeny and genetic testing.
Percent rank (% RANK) represents an animal’s ranking among others within a breed.
| CW | MARB | REA | |
| EPD | 91 | 1.27 | 1.35 |
| ACC | 0.44 | 0.40 | 0.39 |
| % RANK | 1 | 5 | 1 |
Depending on the genomic test, some GEPDs are reported as scores from low to high (1-10). An example is shown in the table below.
| Animal ID | MARB | REA | FAT |
| 12345 | 8 | 5 | 8 |
| 12346 | 9 | 4 | 7 |
| 12347 | 9 | 5 | 8 |
| 12348 | 7 | 7 | 5 |
Selection Indices
Selection indices are reported most often as dollar ($) values above breed average with percentile rankings for each animal. Some selection indices are breed-specific and cannot be compared or will need adjusting to compare across breeds. There are also indices specifically designed for crossbred animals. An example comparison of selection indices between two bulls is listed below.
| Bull A | $W | $F | $G | $B |
| INDEX | 76 | 139 | 93 | 232 |
| % RANK | 10 | 1 | 3 | 1 |
| Bull B | $W | $F | $G | $B |
| INDEX | 75 | 108 | 100 | 208 |
| % RANK | 15 | 20 | 2 | 2 |
GEPD and Index Terminology Key
Some general GEPD and index definitions for beef cattle are listed below. Which values are reported may differ by breed and specific genomic test.
| Production GEPDs | |
| Acronym | Trait |
| CE or CED | Calving ease or calving ease direct |
| BW | Birth weight |
| WW | Weaning weight |
| YW | Yearling weight |
| RADG | Residual average daily gain |
| DMI | Dry matter intake |
| YH | Yearling height |
| SC or SCR | Scrotal circumference |
| Doc | Docility |
| Claw | Claw set (hoof) |
| PAP | Pulmonary arterial pressure (elevation tolerance) |
| HS | Hair shedding |
| Maternal GEPDs | |
| Acronym | Trait |
| HP or HPG | Heifer pregnancy |
| CEM or MCE | Calving ease maternal or maternal calving ease |
| Milk or MM | Maternal milk |
| MKH | Number of herds reported |
| MKD | Number of daughters |
| MW or MCW | Mature weight or mature cow weight |
| MH | Mature height |
| TM | Total maternal |
| MWW | Maternal weaning weight |
| M&G | Maternal milk and growth |
| ME | Maintenance energy |
| STAY | Stayability |
| Carcass GEPDs | |
| Acronym | Trait |
| CW or HCW | Carcass weight or hot carcass weight |
| MB, MRB, or Marb | Marbling |
| RE or REA | Ribeye area |
| BF or Fat | Fat thickness (12th rib) |
| YG | Yield grade |
| SHR | Shear force |
| Index $Values | |
| Acronym | Trait |
| $M | Maternal weaned calf value – larger value generally means increased heifer pregnancy and cow longevity of offspring. Index incorporates calving ease direct and maternal, weaning weight, maternal milk, heifer pregnancy, teat size, udder suspension, functional longevity, docility, mature weight, foot angle, and claw set EPDs. |
| $W | Weaned calf value – larger value generally means increased weaning and yearling weight traits. Index incorporates birth weight, weaning weight, maternal milk, and mature cow size EPDs. |
| $F | Feedlot value – larger value generally means better postweaning performance of offspring. Index incorporates yearling weight, carcass wait, and feed efficiency-related EPDs. |
| $G | Grid value – larger value generally means greater average carcass grid merit of offspring compared with other sires. Index incorporates quality grade and yield grade attributes (including premiums and discounts), and carcass-related EPDs. |
| $B | Beef value – the sum of feedlot $F and grid $G values as a terminal index representing the average dollar value per carcass difference in offspring. Index incorporates weaning and yearling weight, dry matter intake, carcass weight, marbling, ribeye area, and fat EPDs. |
| $C | Combined value ($M and $B) – combines maternal weaned calf value and beef value for commercial operations that keep a select few replacements. |
| $EN | Cow energy value – larger value generally means a greater dollar savings per cow in terms of energy requirements for future daughters, and will likely result in less overall mature size and maternal milk when heavily selected for. |
| BMI$ | Baldy maternal index – larger value generally means greater dollar value for Hereford x Angus crossbred cows. Index incorporates sustained cow fertility and longevity primarily, with some influence of weaning weight, mature cow weight, milk, and carcass weight. |
| CHB$ | Certified Hereford beef index – larger value generally means greater profitability of progeny from Hereford bulls mated to Angus cows. Index incorporates carcass weight, marbling, average daily gain, dry matter intake, back fat, and ribeye area. |
| API | All-purpose index – larger value generally means better average performance of progeny from Simmental, SimAngus, Red Angus, or Gelbvieh bulls mated to mature Angus cows or heifers with some replacements retained. Index incorporates growth and carcass information and some maternal information. |
| TI | Terminal index – larger larger value generally means better average performance of progeny from Simmental, SimAngus, Red Angus, or Gelbvieh bulls mated to mature Angus cows with all offspring sold. Index incorporates growth and carcass information. |