Volume 10 Issue 9
Author: Qianwen Lu, Carol Miles, Lisa DeVetter
Washington State University, Northwestern Washington Research & Extension Center, Mount Vernon, WA
Introduction:
- The current recommendation for floricane red raspberry is to make fertilizer adjustments based on results from annual plant tissue nutrient analyses and observations of cane growth and yield.
- Conventional plant tissue analysis is time consuming and takes 7–14 days for results to be available.
- Petiole sap analysis is a technique used in some vegetable systems and provides real-time information of plant nutrient status (Fig. 1). Results from petiole sap analysis are useful to guide nutrient management for some vegetable crops.
The potential usefulness of petiole sap analysis has not been assessed in raspberry.
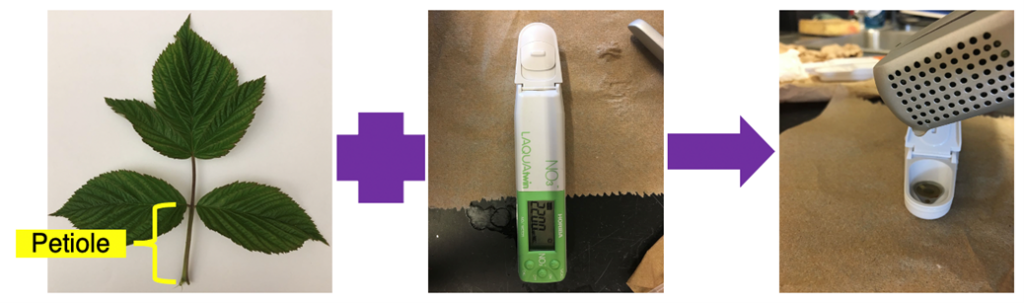
Fig. 1 Petiole sap analysis for floricane red raspberry.
Objective:
- Evaluate the relationship of petiole sap nitrate (NO3–) measured using an ion selective electrode compact meter with leaf tissue total nitrogen (TN) concentration measured with conventional tissue nutrient analysis in red raspberry fertilized at different N rates
Research approach and data collection:
- Plots of ‘Meeker’ raspberry planted in 2017 were fertilized with urea (46% N) at 0, 30, 60, and 90 lbs N/acre in 2019 and 2020. Plots were located at WSU NWREC in Mount Vernon, WA.
- From each plot, the fourth most recent fully expanded whole leaf was collected from 30 representative primocanes per plot from mid-July to late-Aug. at 14-day intervals in 2019 and 2020. Nutrients in caneberry are reported being most stable during this period (Hart et al., 2006).
- At each sampling time, 25 of the leaves from each plot were used for petiole sap NO3–analyses using a compact nitrate ion meter (Horiba Scientific, Aurora, IL) (Fig. 2).
- The other five leaves were kept intact, dried, and sent to a commercial lab (Brookside Labs, New Bremen, OH) for conventional tissue nutrient analysis of TN.
- Data analysis included ANOVA, correlation and regression analyses between petiole sap NO3– and leaf tissue TN concentrations.
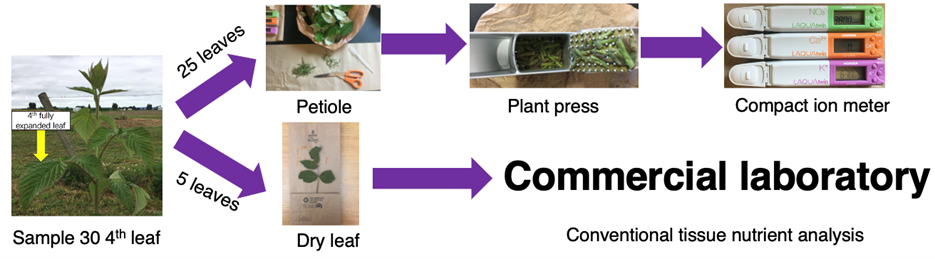
Fig. 2 Experimental procedure flow chart for sample collection and nutrient analysis.
Results:
Fertilizer rate effects
- There were no differences in raspberry petiole sap NO3– and leaf tissue TN concentrations across N fertilizer rates in 2019 and 2020 (Table 1). This finding was surprising and attributed to relatively high levels of soil organic matter (~3%) and estimated nitrogen release (~86 lbs N/acre; determined from pre-treatment soil samples collected in March 2019).
- Leaf tissue TN concentrations were within sufficiency ranges
[2.3–3% according to Hart et al. (2006)]
across all N fertilizer rate treatments and sampling times in 2019 and 2020.
| Fertilizer rate / Years | Petiole sap NO3– (ppm) for 2019 | Petiole sap NO3– (ppm) for 2020 | Leaf tissue TN (%) for 2019 | Leaf tissue TN (%) for 2020 |
| Control (0 lbs N/acre) | 1497.7 | 1873.3 | 2.8 | 3.0 |
| Low (30 lbs N/acre) | 1681.5 | 1843.8 | 2.9 | 2.9 |
| Medium (60 lbs N/acre) | 1882.7 | 1812.5 | 3.0 | 3.0 |
| High (90 lbs N/acre) | 1906.3 | 1708.3 | 2.8 | 2.9 |
| P-value | 0.68 | 0.94 | 0.47 | 0.79 |
| Sampling time | 2019 | 2020 | 2019 | 2020 |
| Mid-July | 1251.9 b z | 2372.9 a | 3.0 a | 2.9 |
| Late-July | 2300.0 a | 2089.6 a | 3.0 a | 2.9 |
| Mid-Aug. | 2131.3 a | 1407.1 b | 2.7 b | 3.0 |
| Late-Aug. | 1285.0 b | 1368.3 b | 2.8 ab | 3.0 |
| P-value | 0.0001 | 0.0001 | 0.003 | 0.09 |
- In 2019, petiole sap NO3– concentrations in late-July and mid-Aug. were greater than levels in mid-July and late-Aug., while leaf tissue TN concentrations were lower in mid-Aug. but similar to late-Aug. concentrations. (Table 1).
- In 2020, petiole sap NO3– concentrations decreased in mid- and late-Aug., while leaf tissue TN concentrations did not differ by sampling time (Table 1).
Correlation of petiole sap NO3– and leaf tissue TN concentrations throughout two years
- Raspberry petiole sap NO3– concentrations were moderately positively correlated to leaf tissue TN concentrations (r = 0.64; P = 0.0007) throughout the two years (Fig. 3).
- The lack of a strong correlation (r < 0.8) between petiole sap NO3– and leaf tissue TN concentrations may be due to physiological, environmental, and methodological variations.
Take-aways:
- Raspberry petiole sap NO3– and leaf tissue TN concentrations differed across sampling times.
- Results from this study were largely inconclusive due to the unexpected lack of a plant response to N fertilizer rates.
- Further field research with plant response to N fertilizer rates is warranted and would provide a better understanding of the potential application of rapid sap analysis using compact ion meters.
Acknowledgements:
- We gratefully acknowledge the financial support from Washington State Department of Agriculture Specialty Crop Block Grant program and the China Scholarship Council.
- We are thankful for the assistance of Sean Watkinson, Chelsea Batten, and Yixin Cai at Washington State University Northwestern Washington Research and Extension Center.

Reference:
Hart, J., Strik, B., Rempel, H., 2006. Caneberries. Nutrient management guide. Ore. State Univ. Ext. Serv., EM8903-E. Available at: OSU Extension Catalog for PNW 780