[row][column][textblock]
Volume 6, Issue 6
Chris Benedict[/textblock][/column][/row][row][column][textblock]The wet, cool 2017 growing season has left a lot of farmers struggling to keep up on tasks and conditions are in stark contrast to 2016.This article summarizes the weather over the past six months.
Growing Degree Days
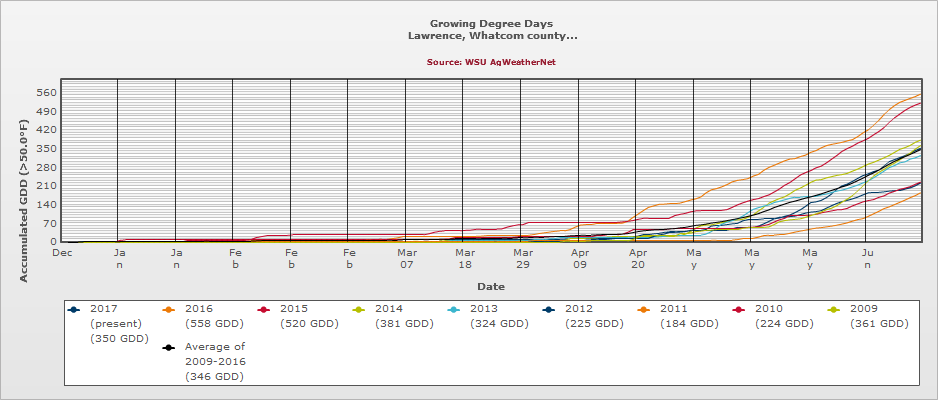
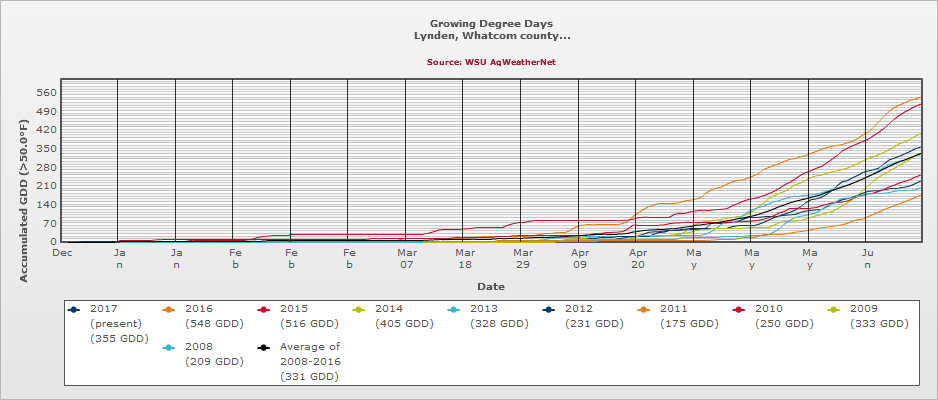
Figures 1-4 are the growing degree days from the four AgWeatherNet stations located in Whatcom County for the dates of 1/1 – 6/13, by year, between 2009 (or 2008) and 2017. For almost all stations 2017 is close to half of the growing degree days when compared to 2016. But when 2017 is compared to the eight (or nine) year average we are just slightly above (Lawrence and Lynden station) or slightly below (Nooksack and Ten Mile) in degree days[/textblock][textblock]Figure 1. Growing degree days, 2009-2017, Lawrence weather station. (click on image for larger size)
[/textblock][textblock]Figure 2. Growing degree days, 2008-2017, Lynden weather station. (click on image for larger size)
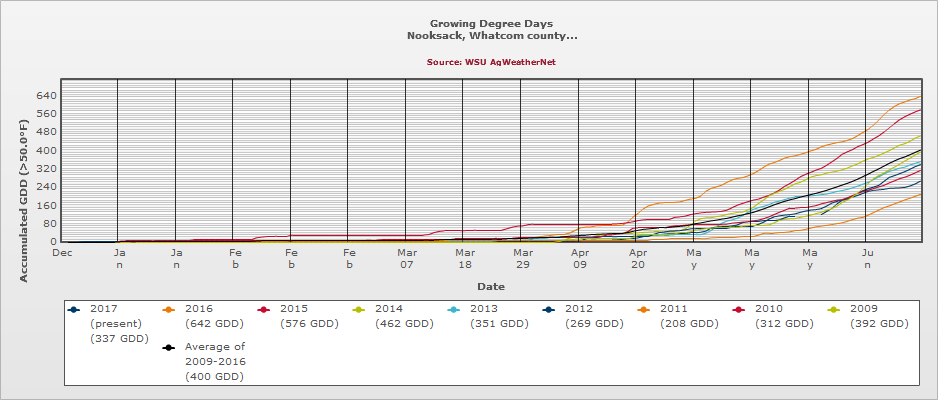
 [/textblock][textblock]Figure 3. Growing degree days, 2008-2017, Nooksack weather station. (click on image for larger size)
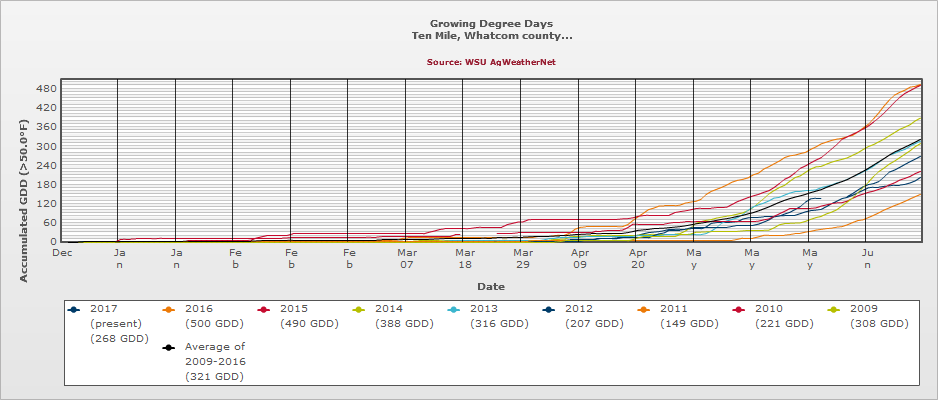
 [/textblock][textblock]Figure 4. Growing degree days, 2009-2017, Ten mile weather station. (click on image for larger size)
 [/textblock][textblock]Precipitation
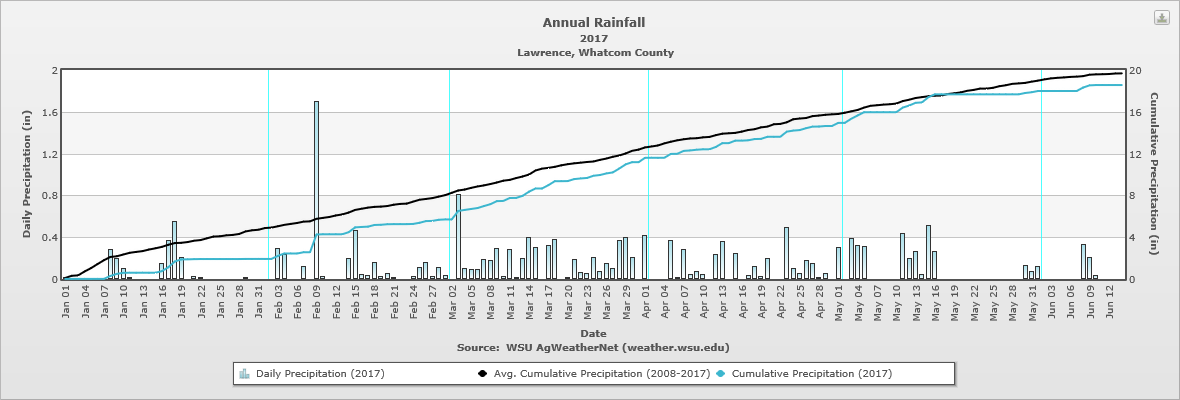
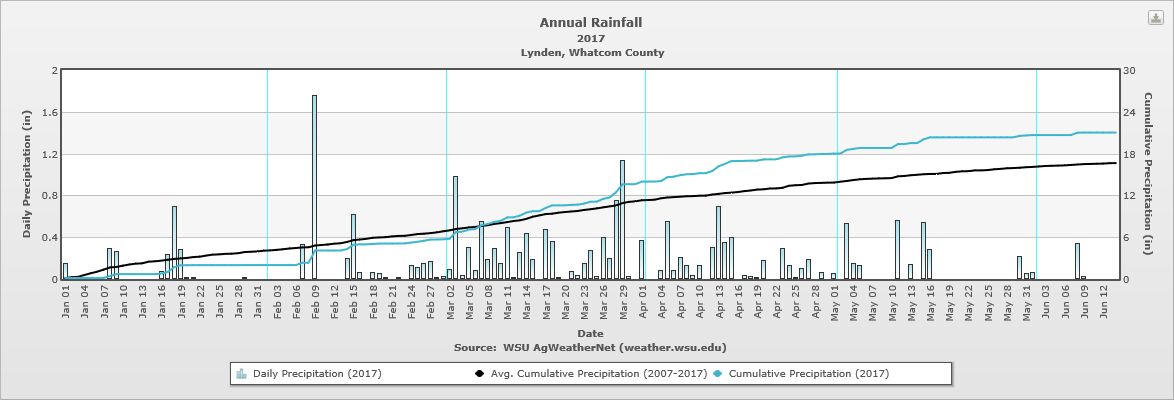
For three of the four weather (Lynden, Nooksack, Ten Mile) stations in the county cumulative precipitation is greater than the last 10 or 11 growing season (Figures 5-8). For two of these stations (Lynden and Nooksack), the cumulative precipitation surpassed the average in early to mid-march.[/textblock][textblock]Figure 5. Annual rainfall, 2008-2017, Lawrence weather station. (click on image for larger size)
 [/textblock][textblock]Figure 6. Annual rainfall, 2007-2017, Lynden weather station. (click on image for larger size)
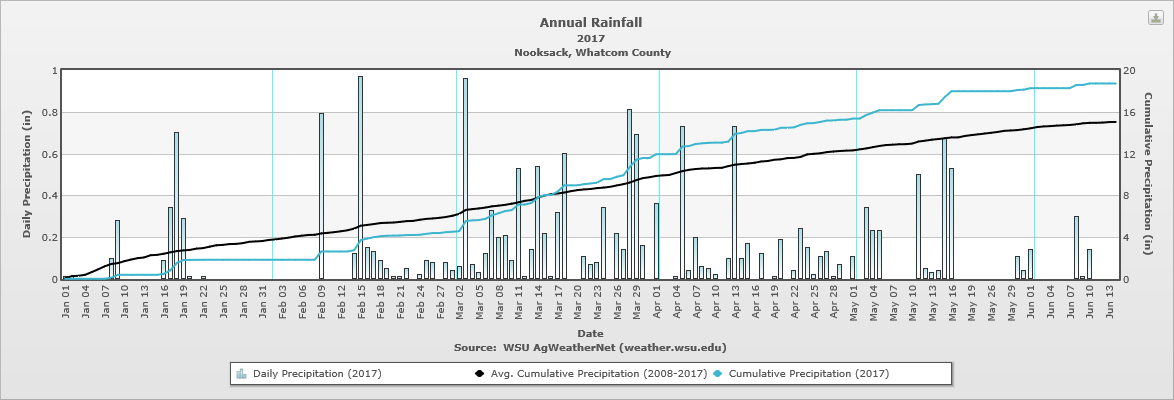
 [/textblock][textblock]Figure 7. Annual rainfall, 2008-2017, Nooksack weather station. (click on image for larger size)
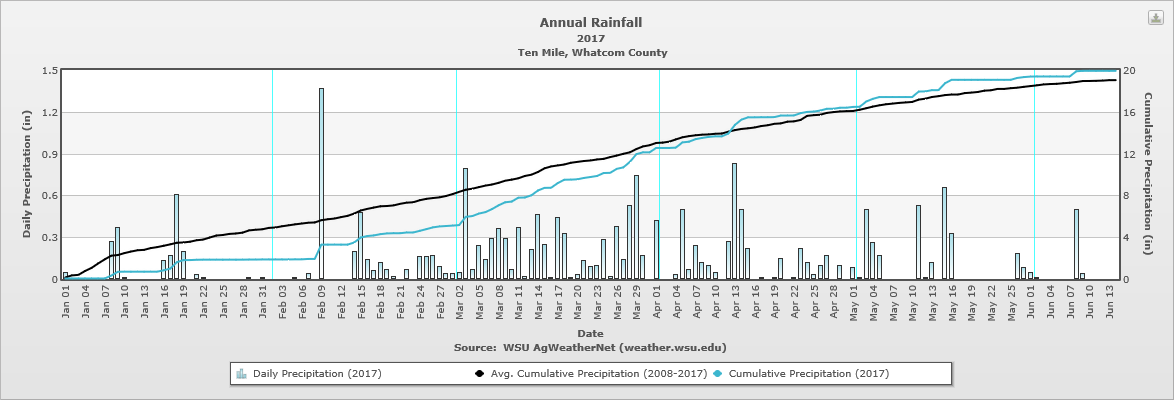
 [/textblock][textblock]Figure 8. Annual rainfall, 2008-2017, Ten mile weather station. (click on image for larger size)
 [/textblock][/column][/row]