Volume 14 Issue 1
Authors: Pedro Rojas-Barros, Emma Rogers, Clark Kogan, and Lisa Wasko DeVetter
Cold hardiness is a dynamic process that strongly depends on air temperatures. As temperatures cool down in the fall, buds gradually acclimate and gain cold hardiness. In contrast, as temperatures rise in the late winter and spring, buds deacclimate and start losing hardiness. Deacclimation can occur during the winter in response to warm spells, although buds may partially reacclimate if cold temperatures return.
The ability of buds to reacclimate depends, in part, on chill accumulation. Chill is typically defined as the accumulation of temperatures between 32 and 42 °F. Once sufficient chill has been accumulated, buds transition into a “ready-to-grow” stage, and their capacity to regain hardiness after warm periods becomes limited.
Because these processes vary among species, cultivars, and environments, it is important to monitor cold hardiness across different conditions. This information helps us move closer to our long-term goal of developing a regionally relevant predictive cold hardiness tool that growers can use to better manage freeze risk.
What We Measured
We estimated cold hardiness using a laboratory-based freeze assay, where buds are exposed to controlled freezing temperatures and then scored for damage (discussed in “Chilling Insights -Blackberry Cold Hardiness in the Pacific Northwest,” September 2025) . From these tests, we calculate the temperature at which 50% of fruiting buds are damaged (LT50). More negative LT₅₀ values indicate greater cold hardiness.
This season, we monitored:
- Blackberry: ‘Victoria’ and ‘Celestial’ [Skagit County and British Columbia (BC) sites]
- Raspberry: ‘Kulshan’ and ‘Meeker’ (Whatcom County)
Samples were collected every week for the Skagit County samples and every two weeks for BC and Whatcom County samples, allowing us to track how cold hardiness changed over time.
Comparing Two Seasons in Blackberry
When we compare the current Fall-Winter season to last year for ‘Victoria’ and ‘Celestial’ blackberry growing in Skagit County, several important patterns emerge.
1. Fall acclimation:
Sample collection in the 25-26 season started in early September instead of mid-October and we observed that buds of both cultivars gradually gained cold hardiness from early September through November as temperatures cooled. The LT₅₀ values during overlapping time periods were similar compared to the previous 24-25 season in both cultivars.
2. Early-Winter temperatures and cold hardiness:
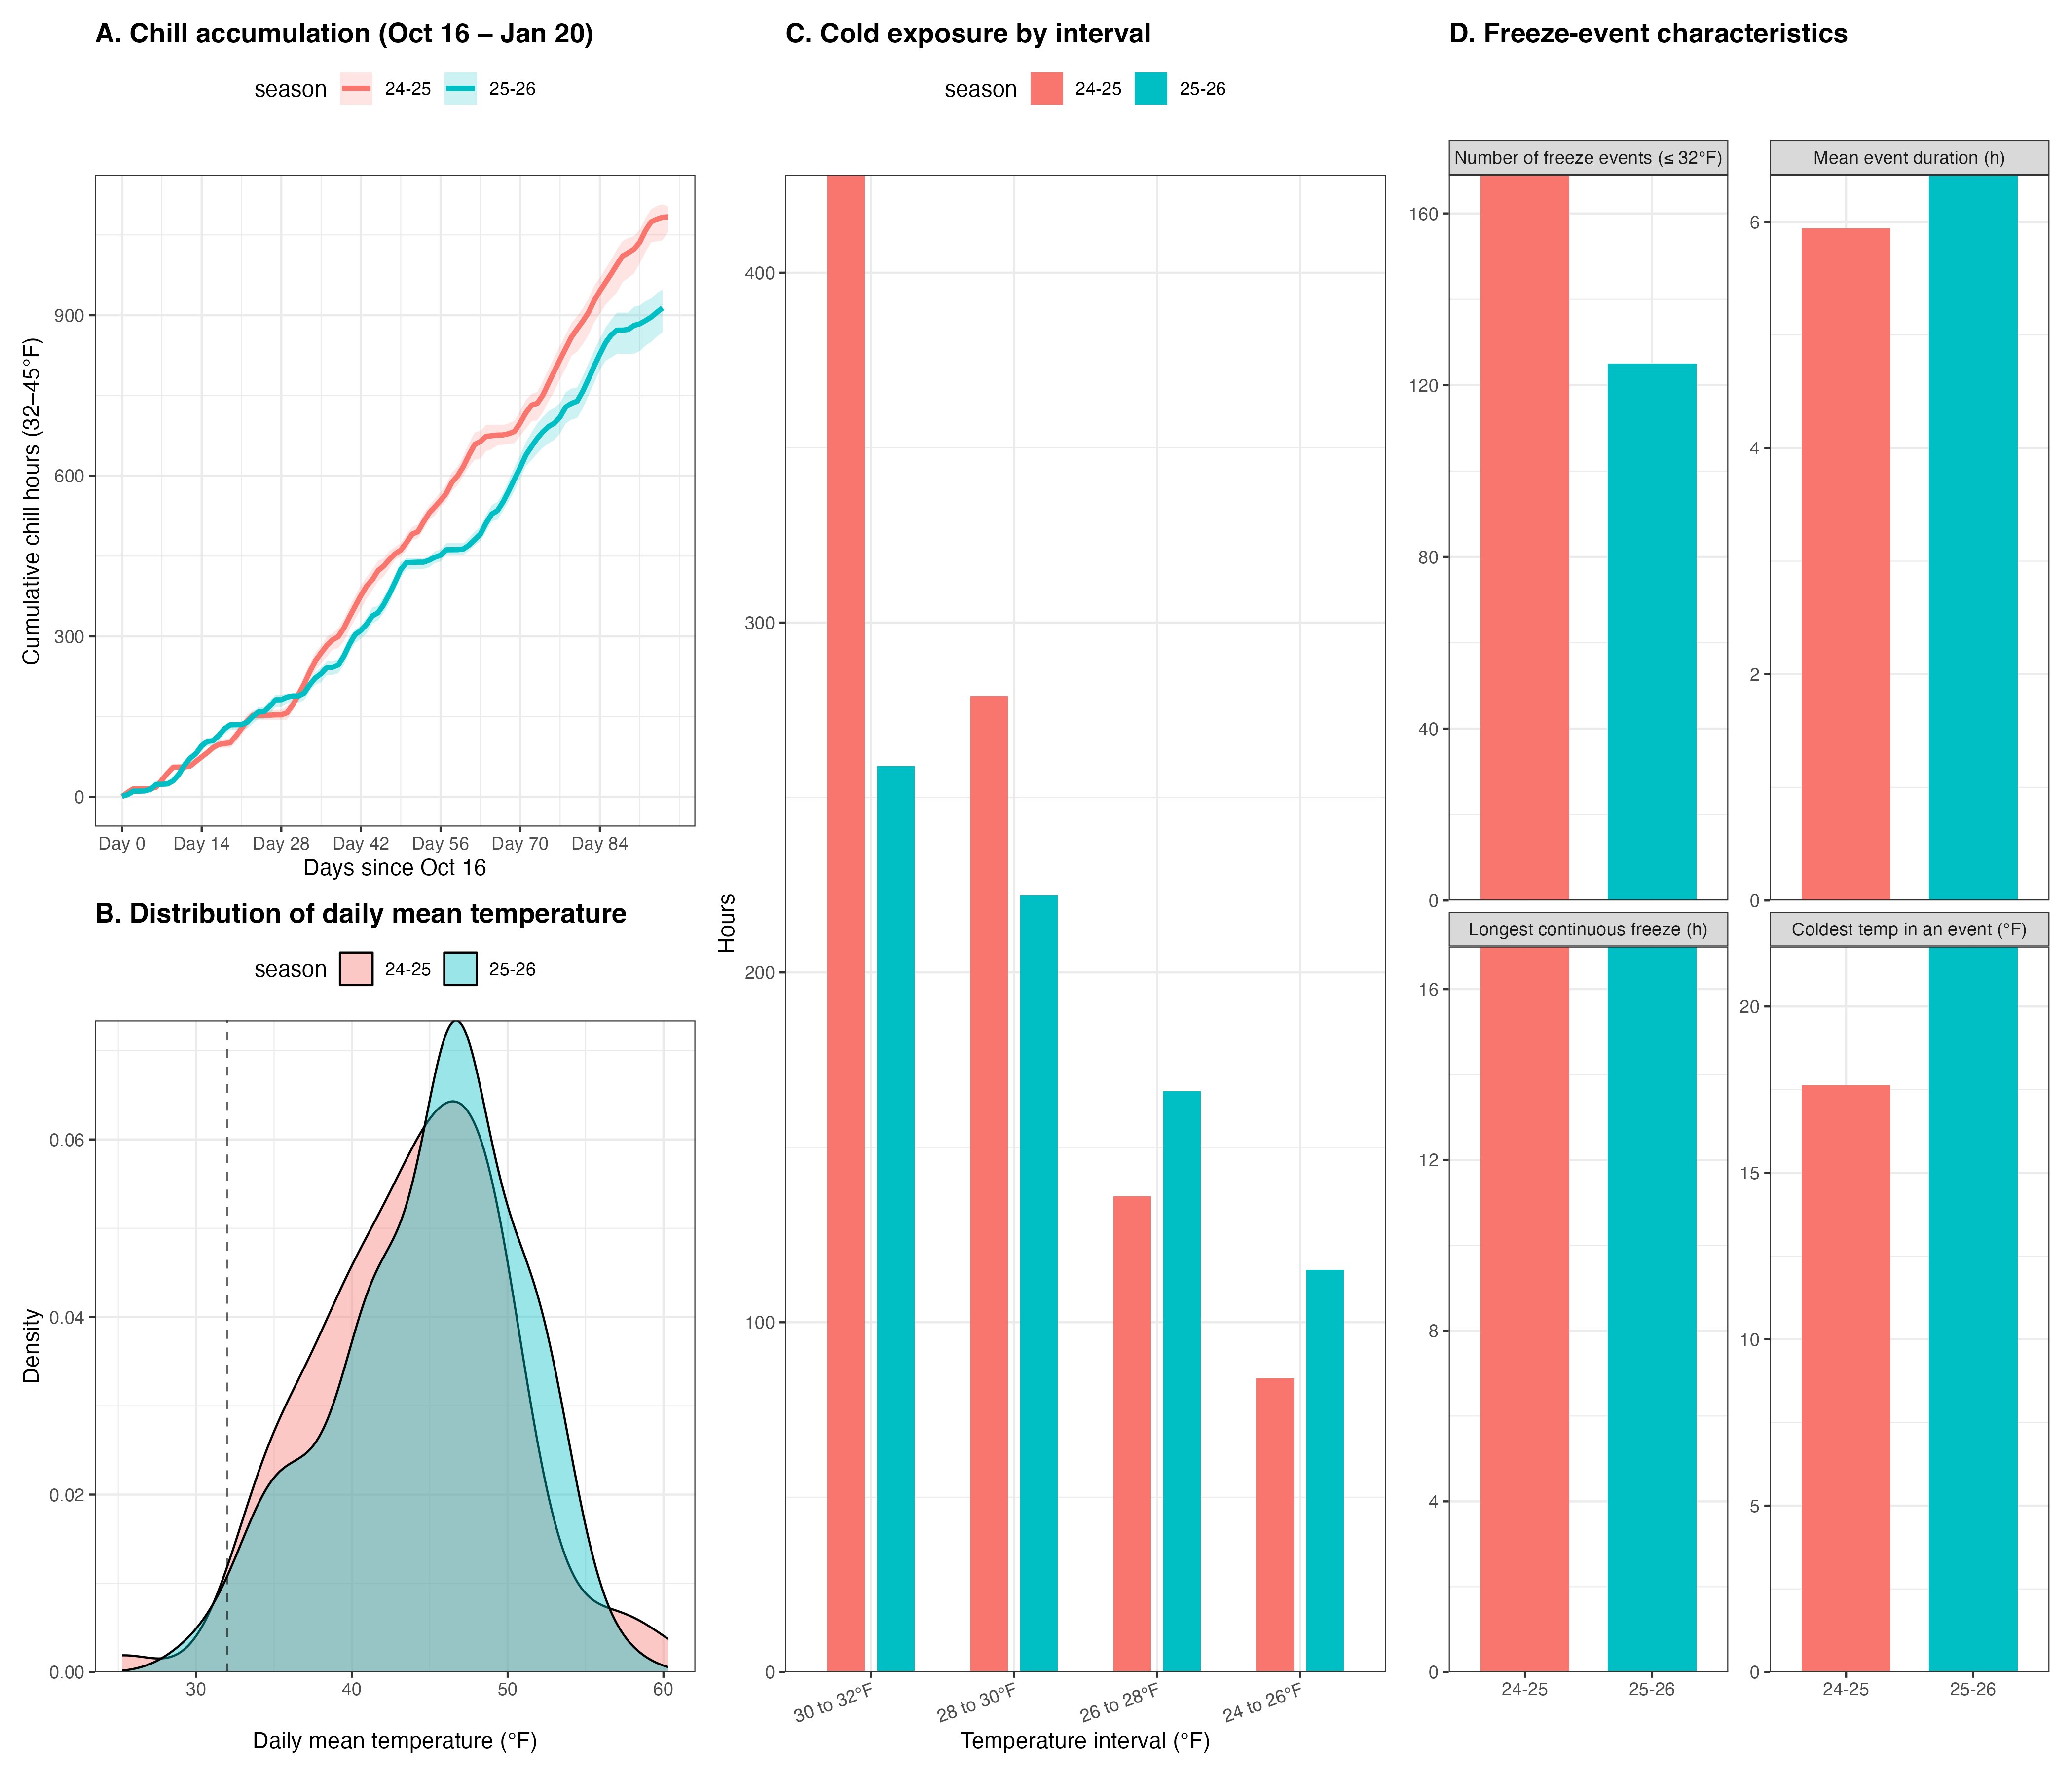
The 24-25 season was colder than the current season, with greater chill accumulation and a higher frequency of freezing temperatures (Fig. 1). Chill accumulation progressed more steadily through mid-winter during the 24-25 season, whereas accumulation slowed during the 25-26 season, coinciding with warmer temperature periods (Fig. 1A). The distribution of daily mean temperatures was also shifted toward colder values in 24–25, while the 25–26 season exhibited a higher frequency of warmer daily means (Fig. 1B). In contrast, the 25-26 season to date has been characterized by lower chill accumulation and fewer freezing events, although freezing temperatures were more intense when they occurred (Fig. 1C). Freeze events in 24-25 were more frequent but generally shorter, whereas the 25-26 season experienced fewer events with longer durations and lower minimum temperatures (Fig. 1D).
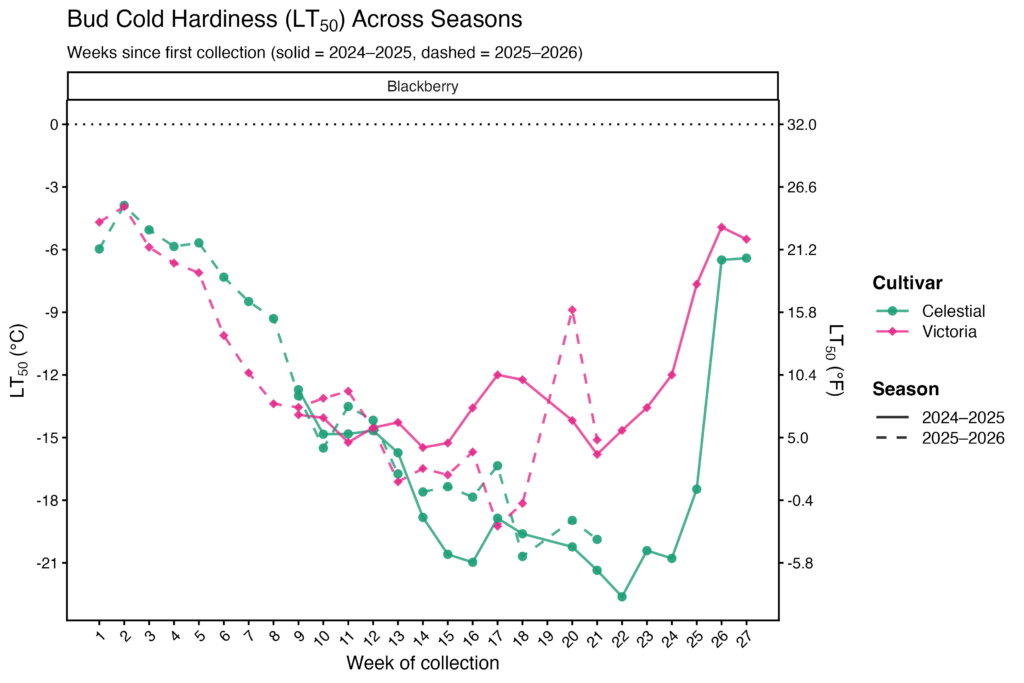
Regarding cold hardiness, during the 24-25 season, maximum cold hardiness in ‘Victoria’ was reached in late January (LT50 = 3.0 °F), while ‘Celestial’ reached a LT50 of -7.6 °F during the same period (Fig. 2). During the 25-26 season, maximum cold hardiness in ‘Victoria’ was reached earlier, in late December, and a similar pattern was observed in ‘Celestial’. However, a warm spell during January affected the two cultivars differently. ‘Victoria’ exhibited a sharp deacclimation during mid-January, whereas ‘Celestial’ was less affected. [LD2] The mid-January freezing temperatures observed in the past week promoted a quick reacclimation in ‘Victoria’ (LT50 = 3.0 °F), while ‘Celestial’ continued showing similar LT50 values as previous weeks.
3. Late winter deacclimation:
As temperatures warmed in late January and February, both cultivars began to lose cold hardiness. During the 24-25 season, deacclimation was more pronounced and occurred earlier in ‘Victoria’, whereas ‘Celestial’ maintained greater cold tolerance for a longer period before rapidly deacclimating towards the end of winter.
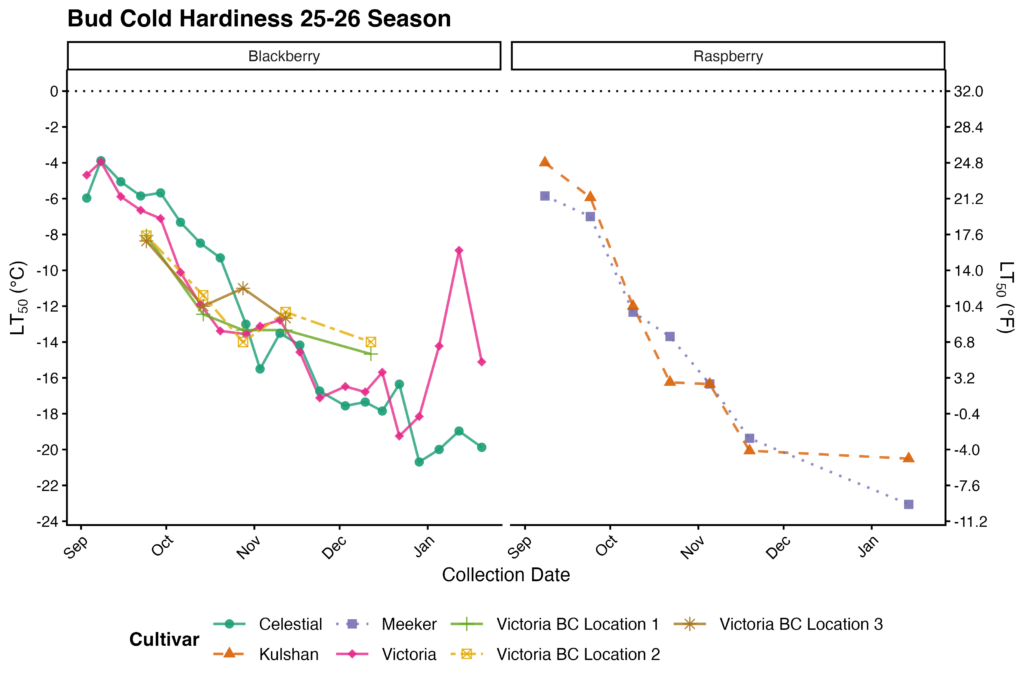
Expanding the Study: Raspberry and British Columbia Sites
This season, we also included raspberry cultivars (‘Kulshan’ and ‘Meeker’) and sampling sites of ‘Victoria’ in British Columbia (Fig. 3) Bud cold hardiness increased through the fall and early winter in all cultivars, but the timing and extent of cold hardiness differed among cultivars and locations (Fig. 3). In blackberry, ‘Victoria’ showed less cold hardiness variation during the Fall across locations, but differences were evident towards the end of December, with higher cold hardiness in buds collected from Skagit County. Regarding raspberry, ‘Kulshan’ showed a similar response to cold temperatures during the Fall-Winter period compared to ‘Meeker’. By the end of January, ‘Meeker’ remained slightly more cold hardy than ‘Kulshan’ (Fig. 3).
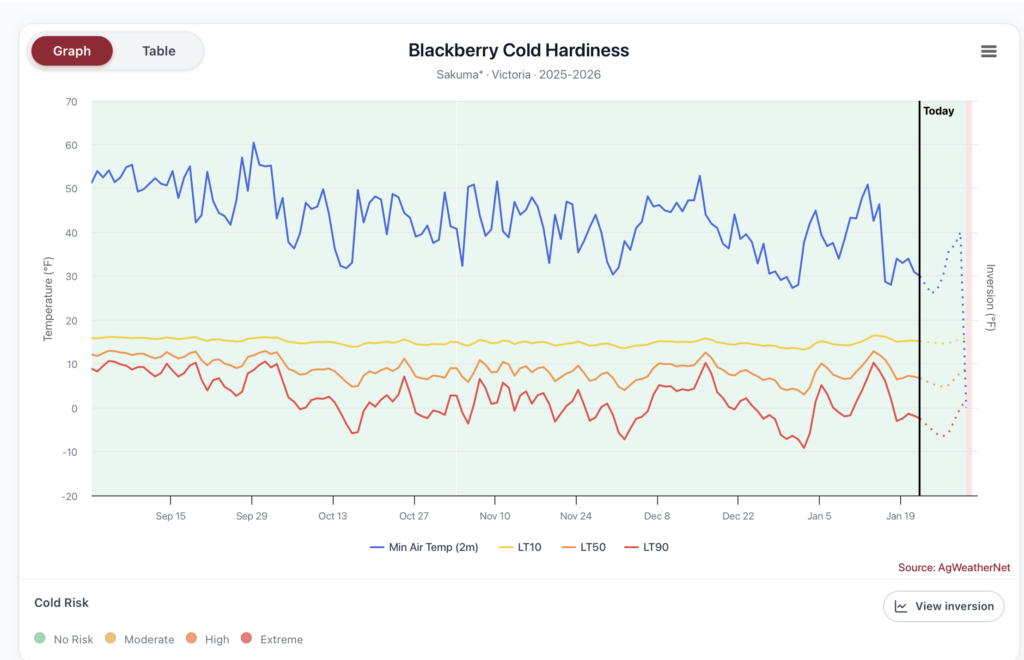
Blackberry Cold Hardiness Model (AgWeatherNet)
Figure 4 shows estimated blackberry bud cold hardiness based on a temperature-driven beta model. The model uses hourly air temperature data from AgWeatherNet to estimate lethal temperature thresholds (LT10, LT50, and LT90), which represent the temperatures at which 10%, 50%, and 90% of fruiting buds are expected to be injured.
Model outputs are updated automatically as new temperature data become available. The solid lines represent estimated cold hardiness thresholds, while the minimum air temperature is shown for reference. A short-term projection based on the weather forecast is also displayed to indicate potential changes in cold hardiness.
Access the Blackberry Cold Hardiness Tool:
👉 https://test.awn.cahnrs.wsu.edu/ The model is available for free but requires first-time users to create a username and password. Once logged into WSU AgWeatherNet, log into “Models” ® “Blackberry”. Be sure to select the weather station closest to your field of interest.
Note this model is still undergoing refinement and we value your feedback. If you have any comments or questions regarding the model on AgWeatherNet, please fill out this form: AgWeatherNet New Portal Feedback – Beta testers – Fill out form