[row][column][textblock]
Volume 10 Issue 7
The recent heat wave June 25 through June 28 shattered records. It also damaged crops and placed additional pressure on irrigation systems. Precipitation has been below the three year average for many stations prior to the heat entering the picture. So just how hot was it and how does it compare to previous years? Let’s take a look.
Air Temperature
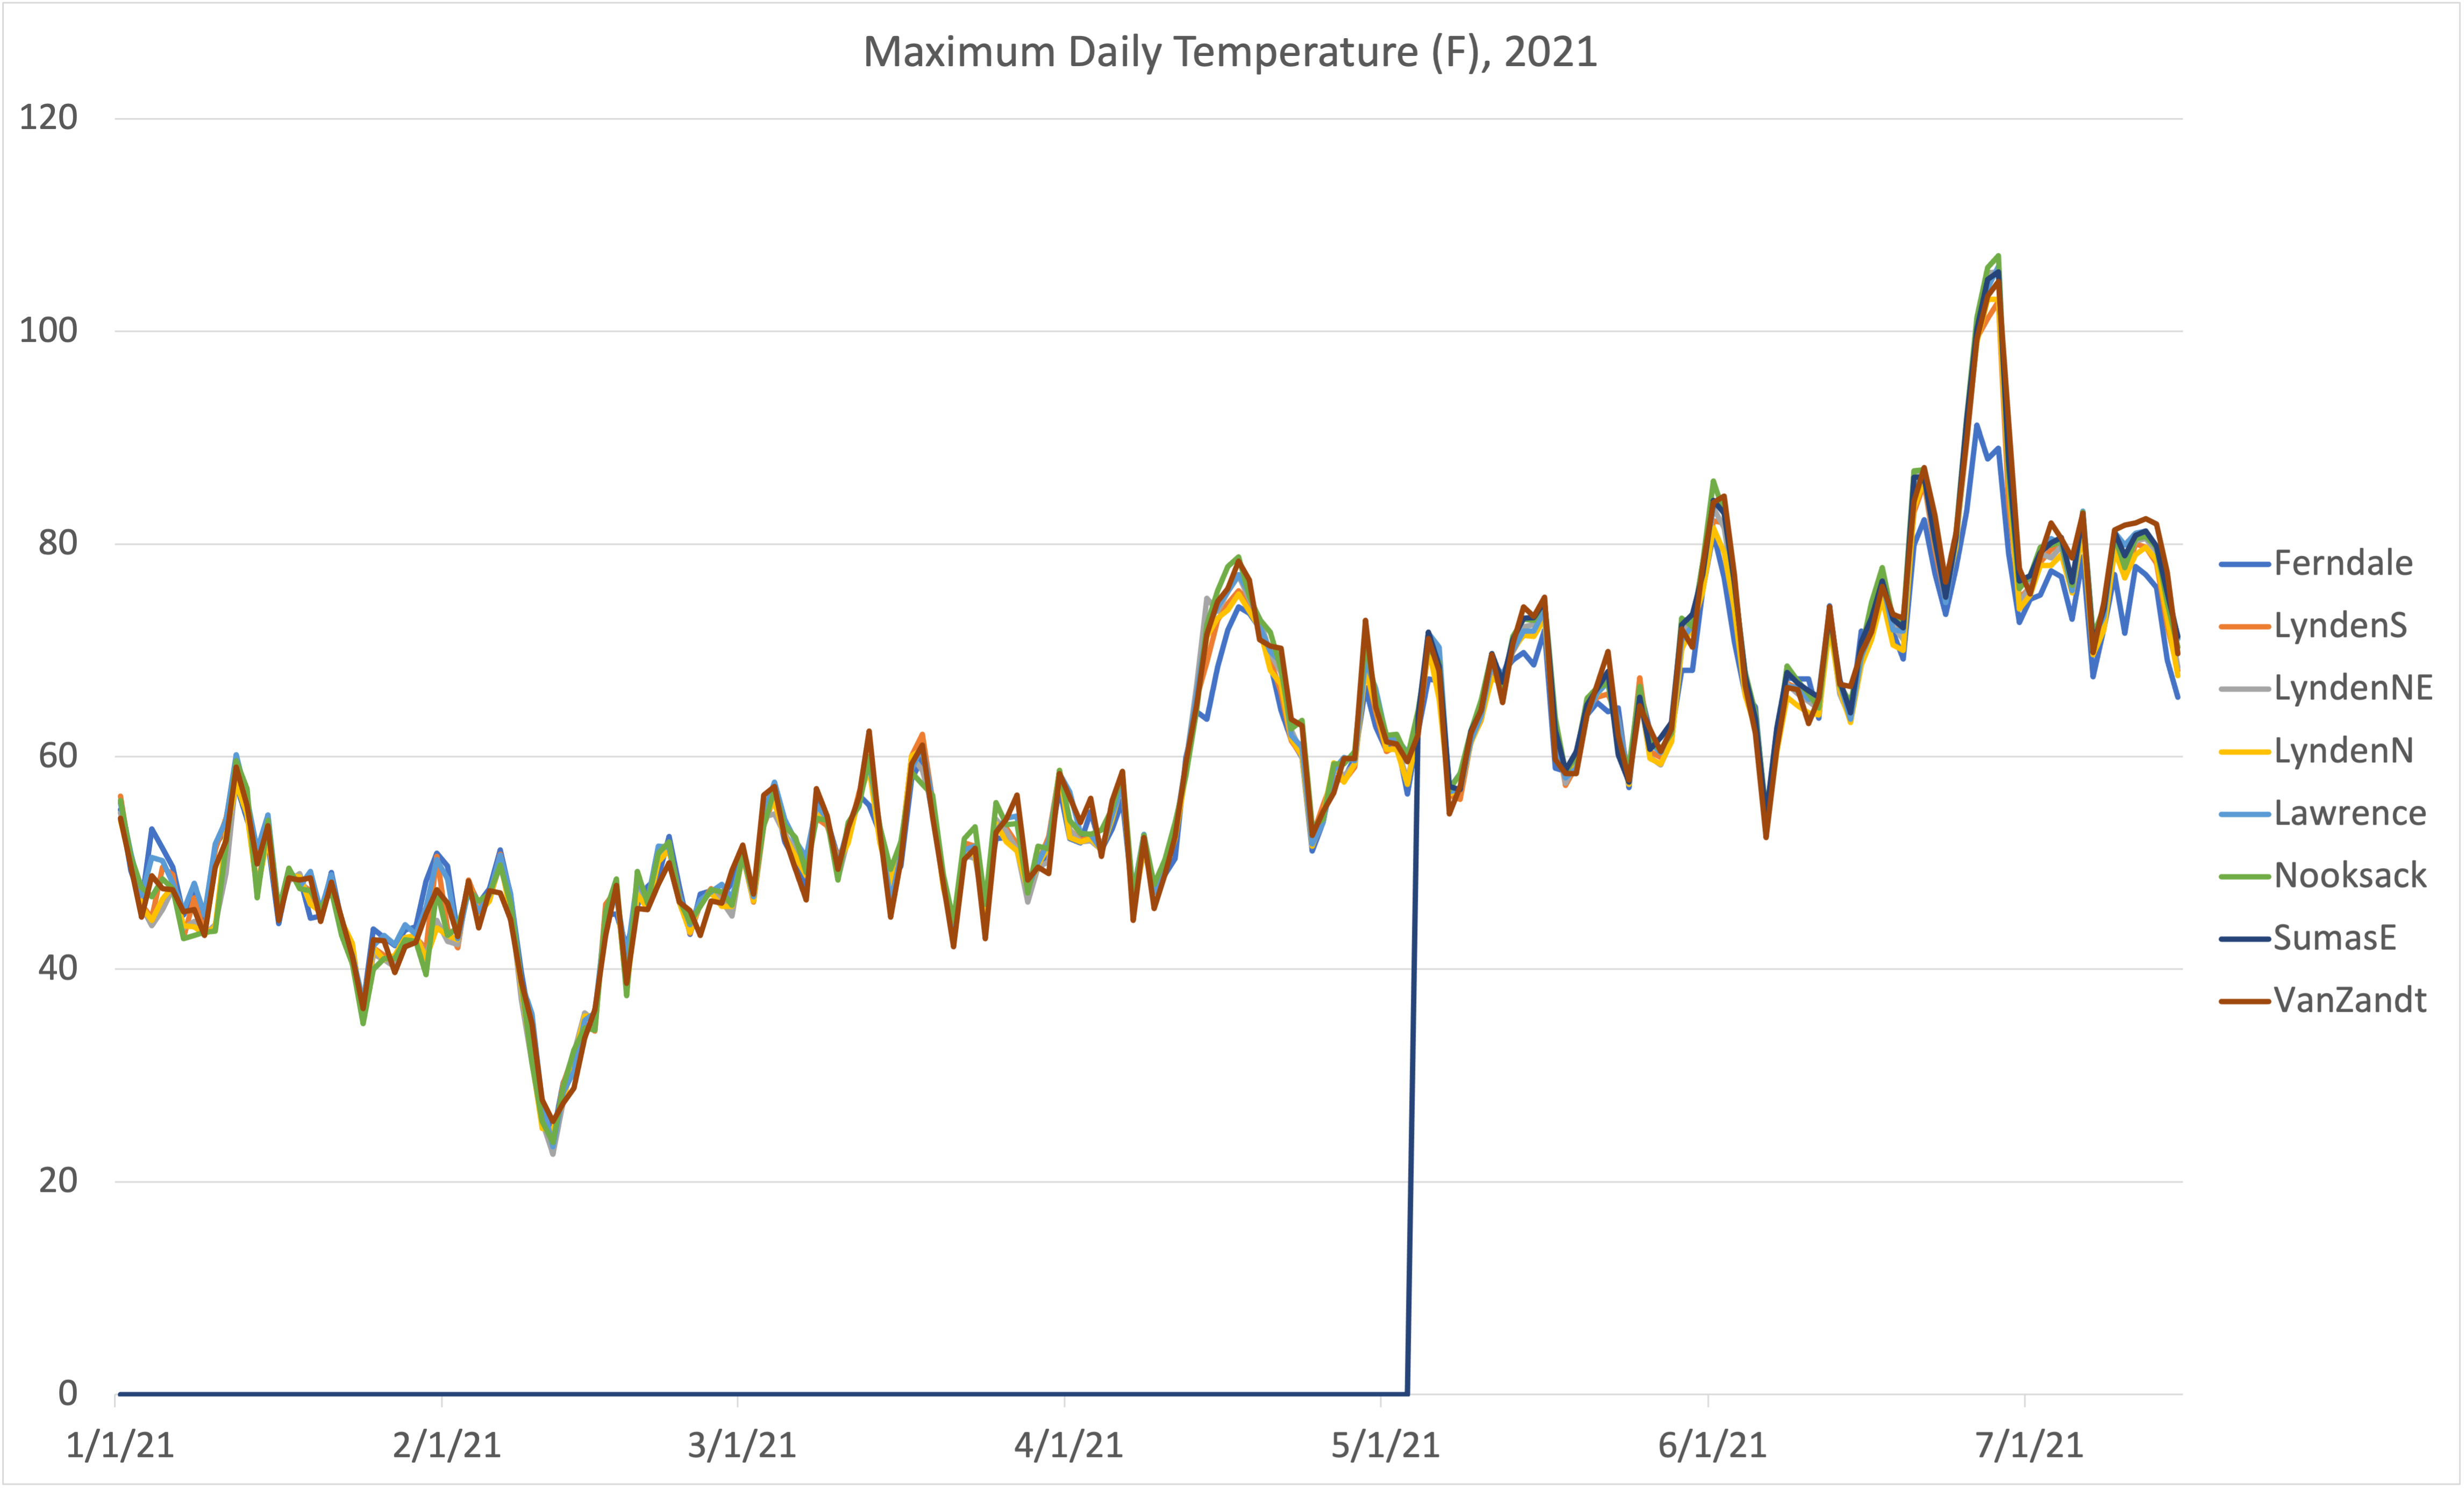
Maximum temperatures (Fig. 1) for the time period occurred on June 28 for all stations.
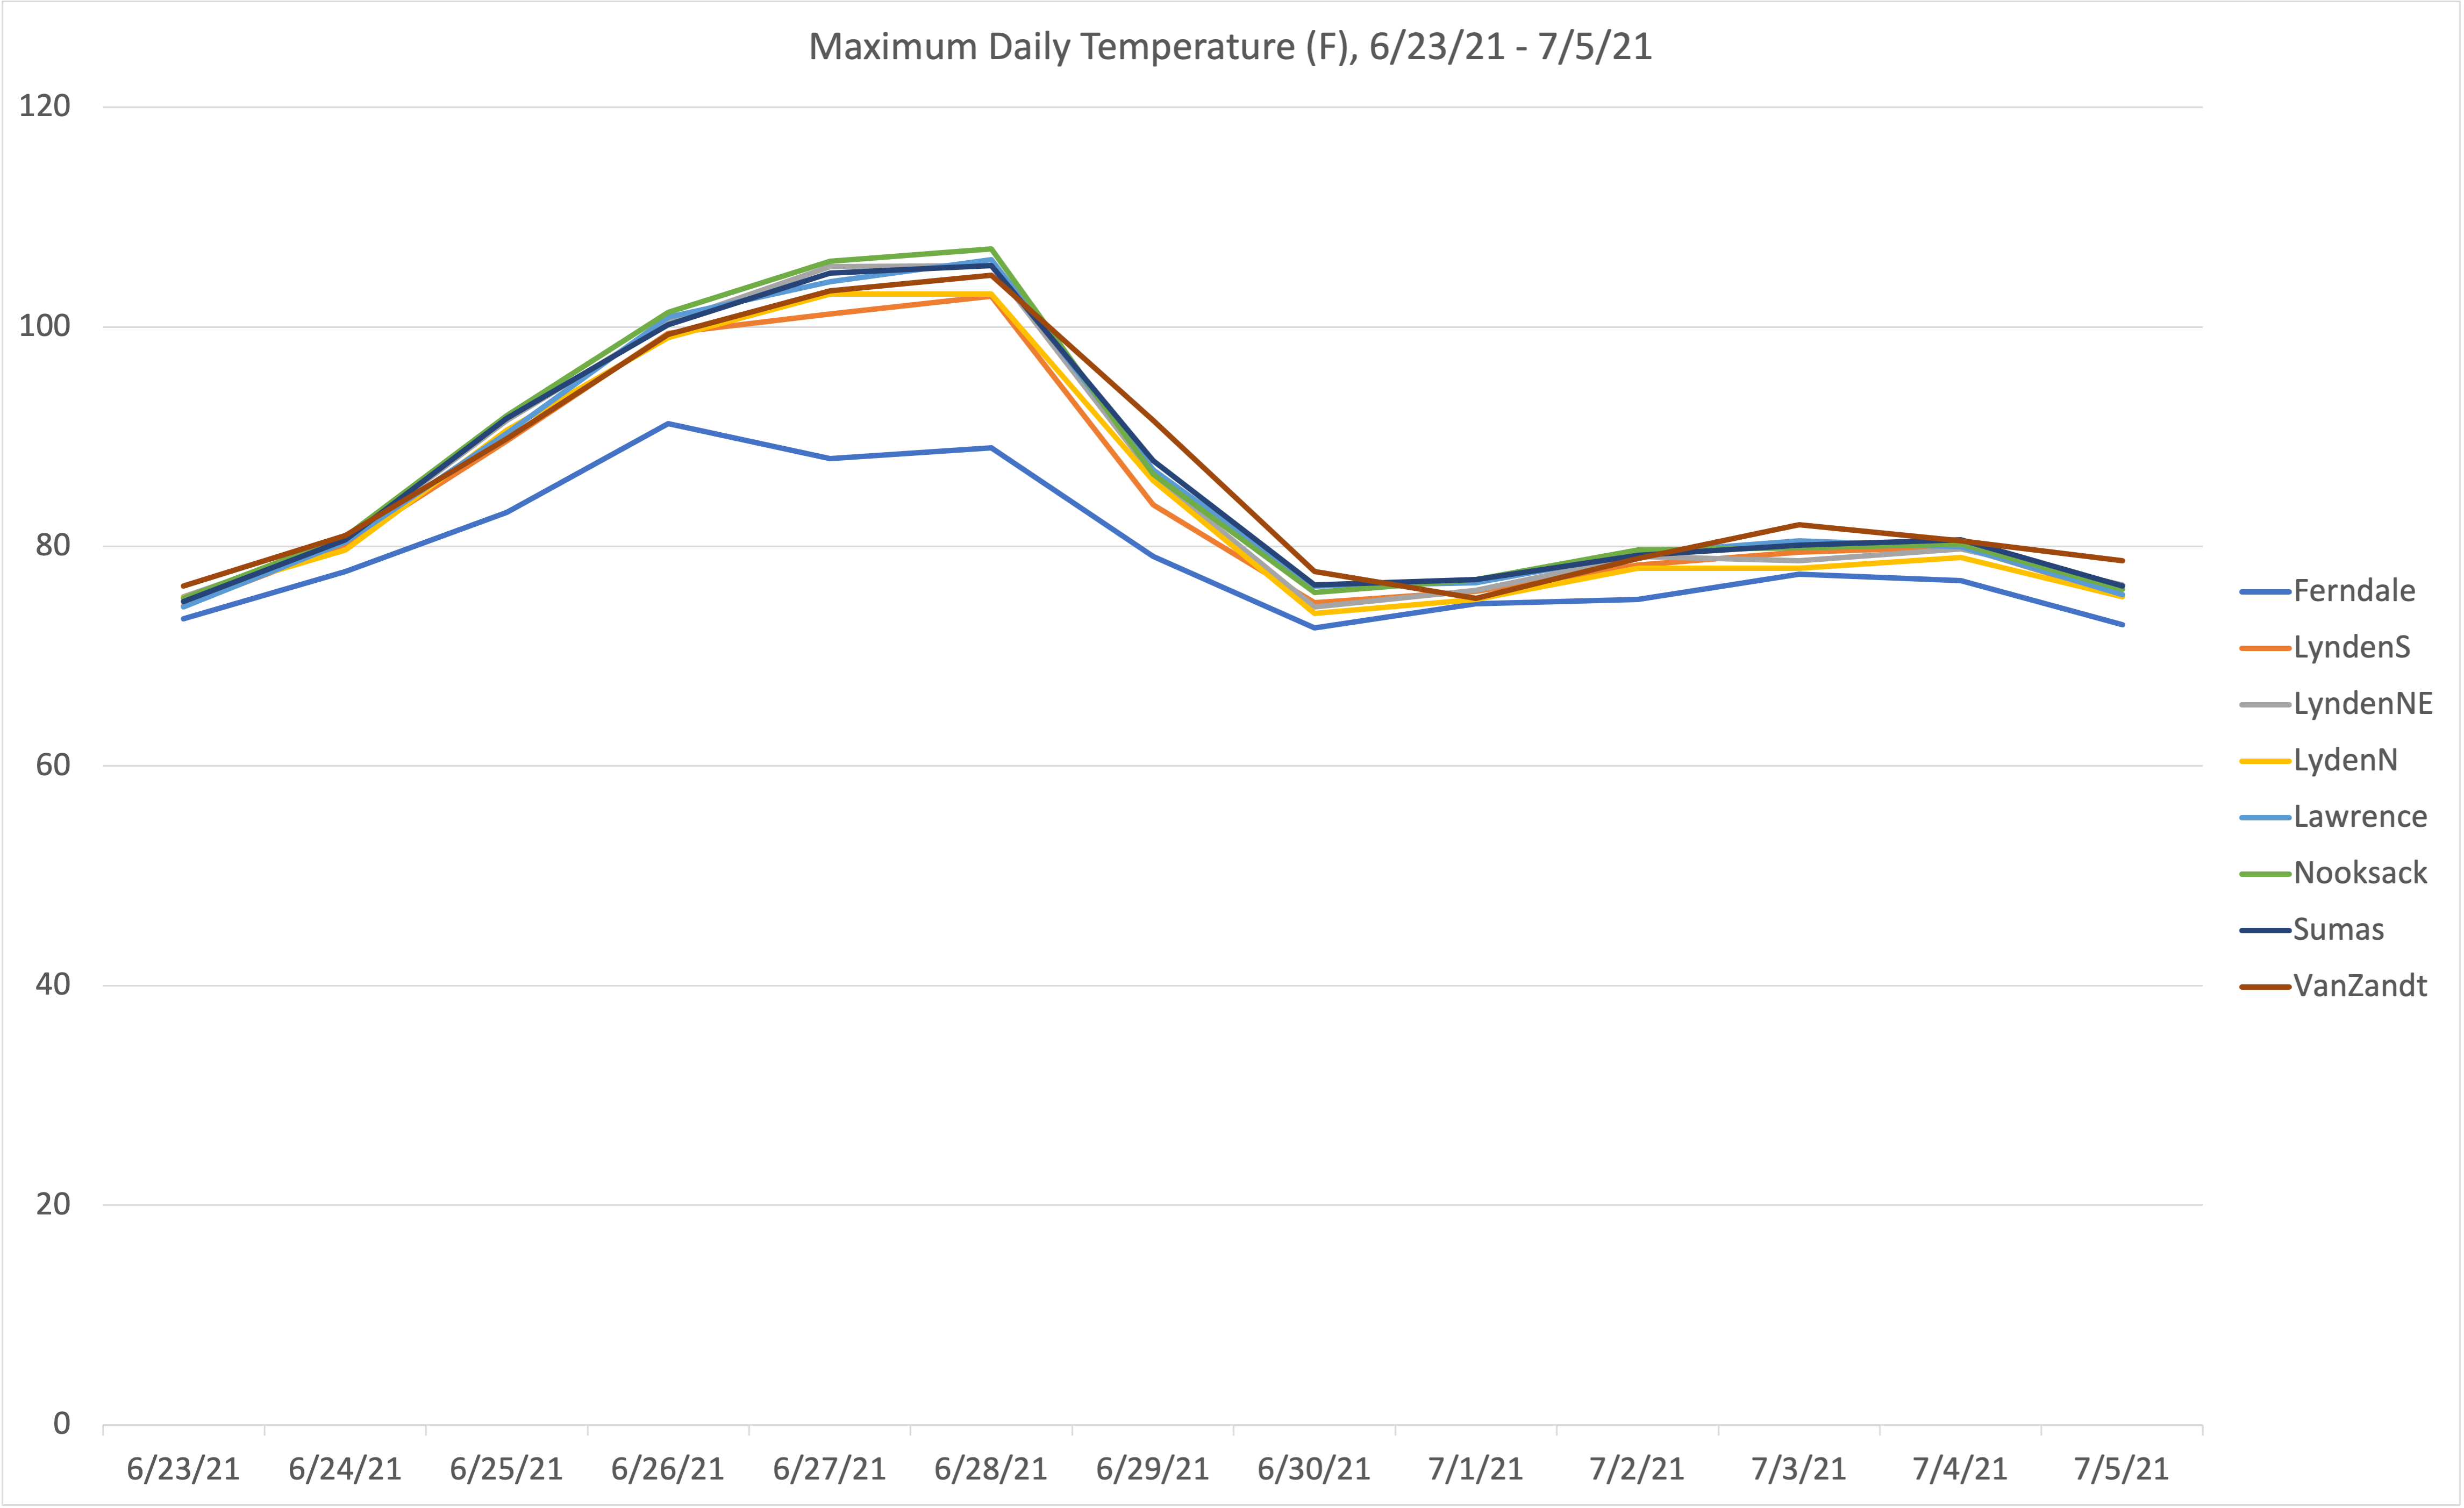
Upon a closer look (Fig. 2) during the peak heat, the Ferndale station was between 8 and 14 F cooler than the other stations. SumasE reached the highest recorded temperatures than all other stations of 100.2 (6/26), 104.9 (6/27), and 105.6 (6/28) underscoring the increased temperature as you move East and North in the county.
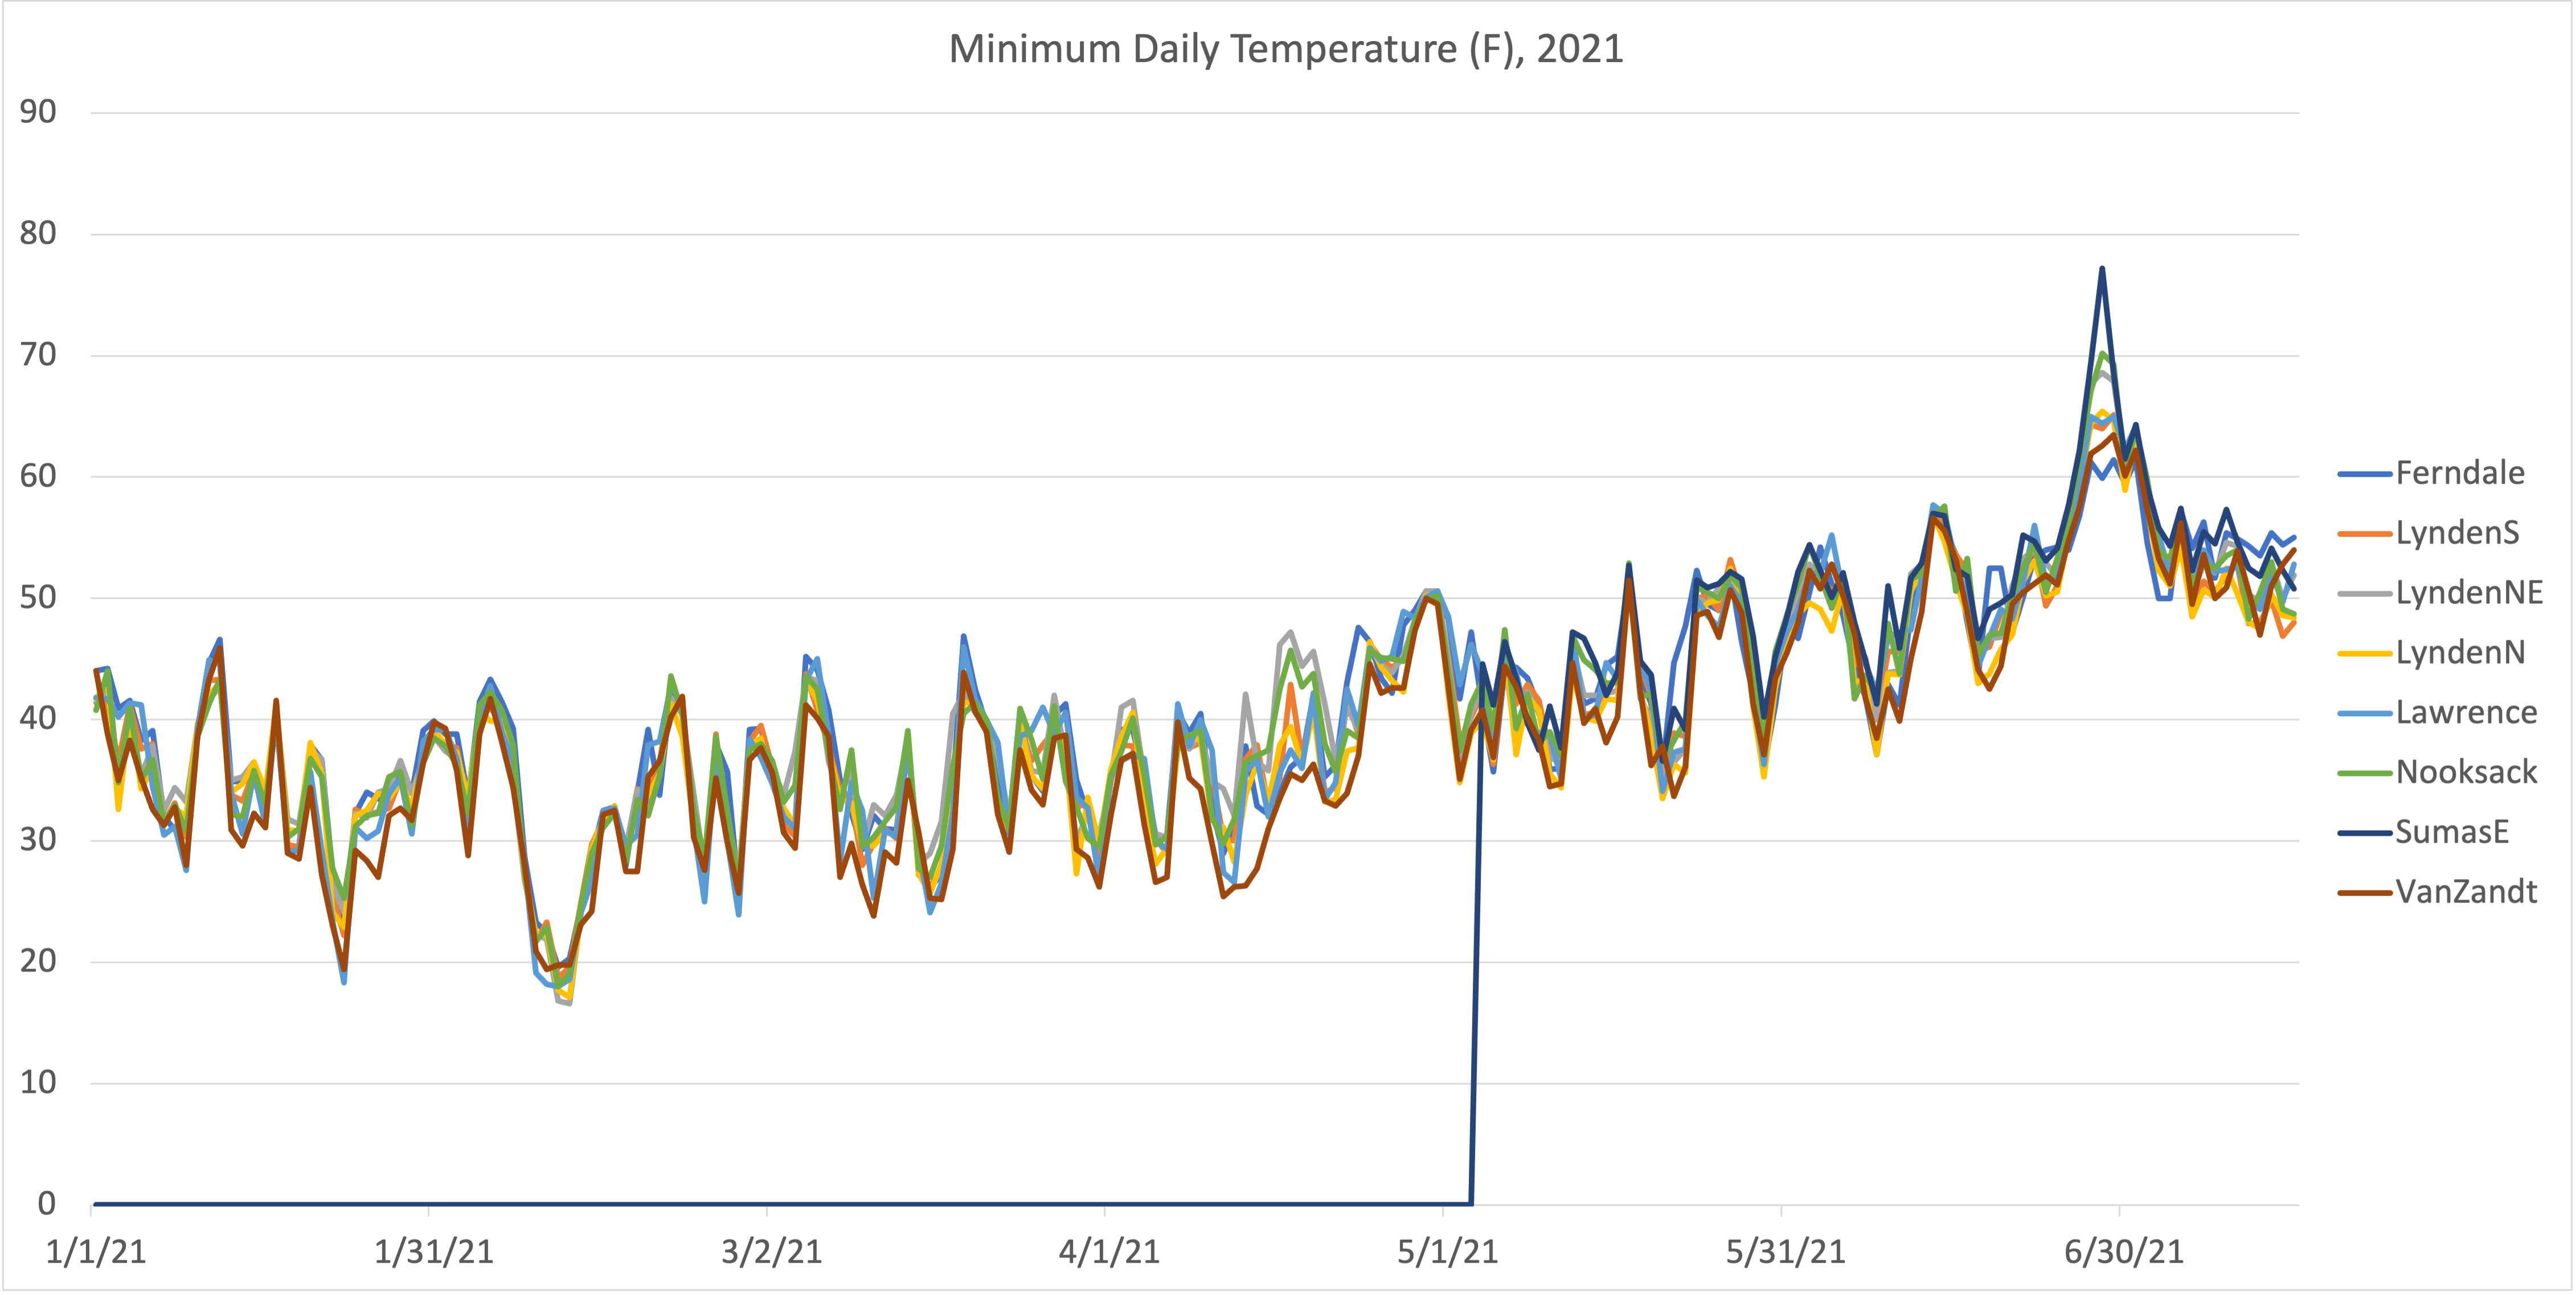
Looking (Fig. 3) at the minimum air temperatures they also peaked during the same time period.
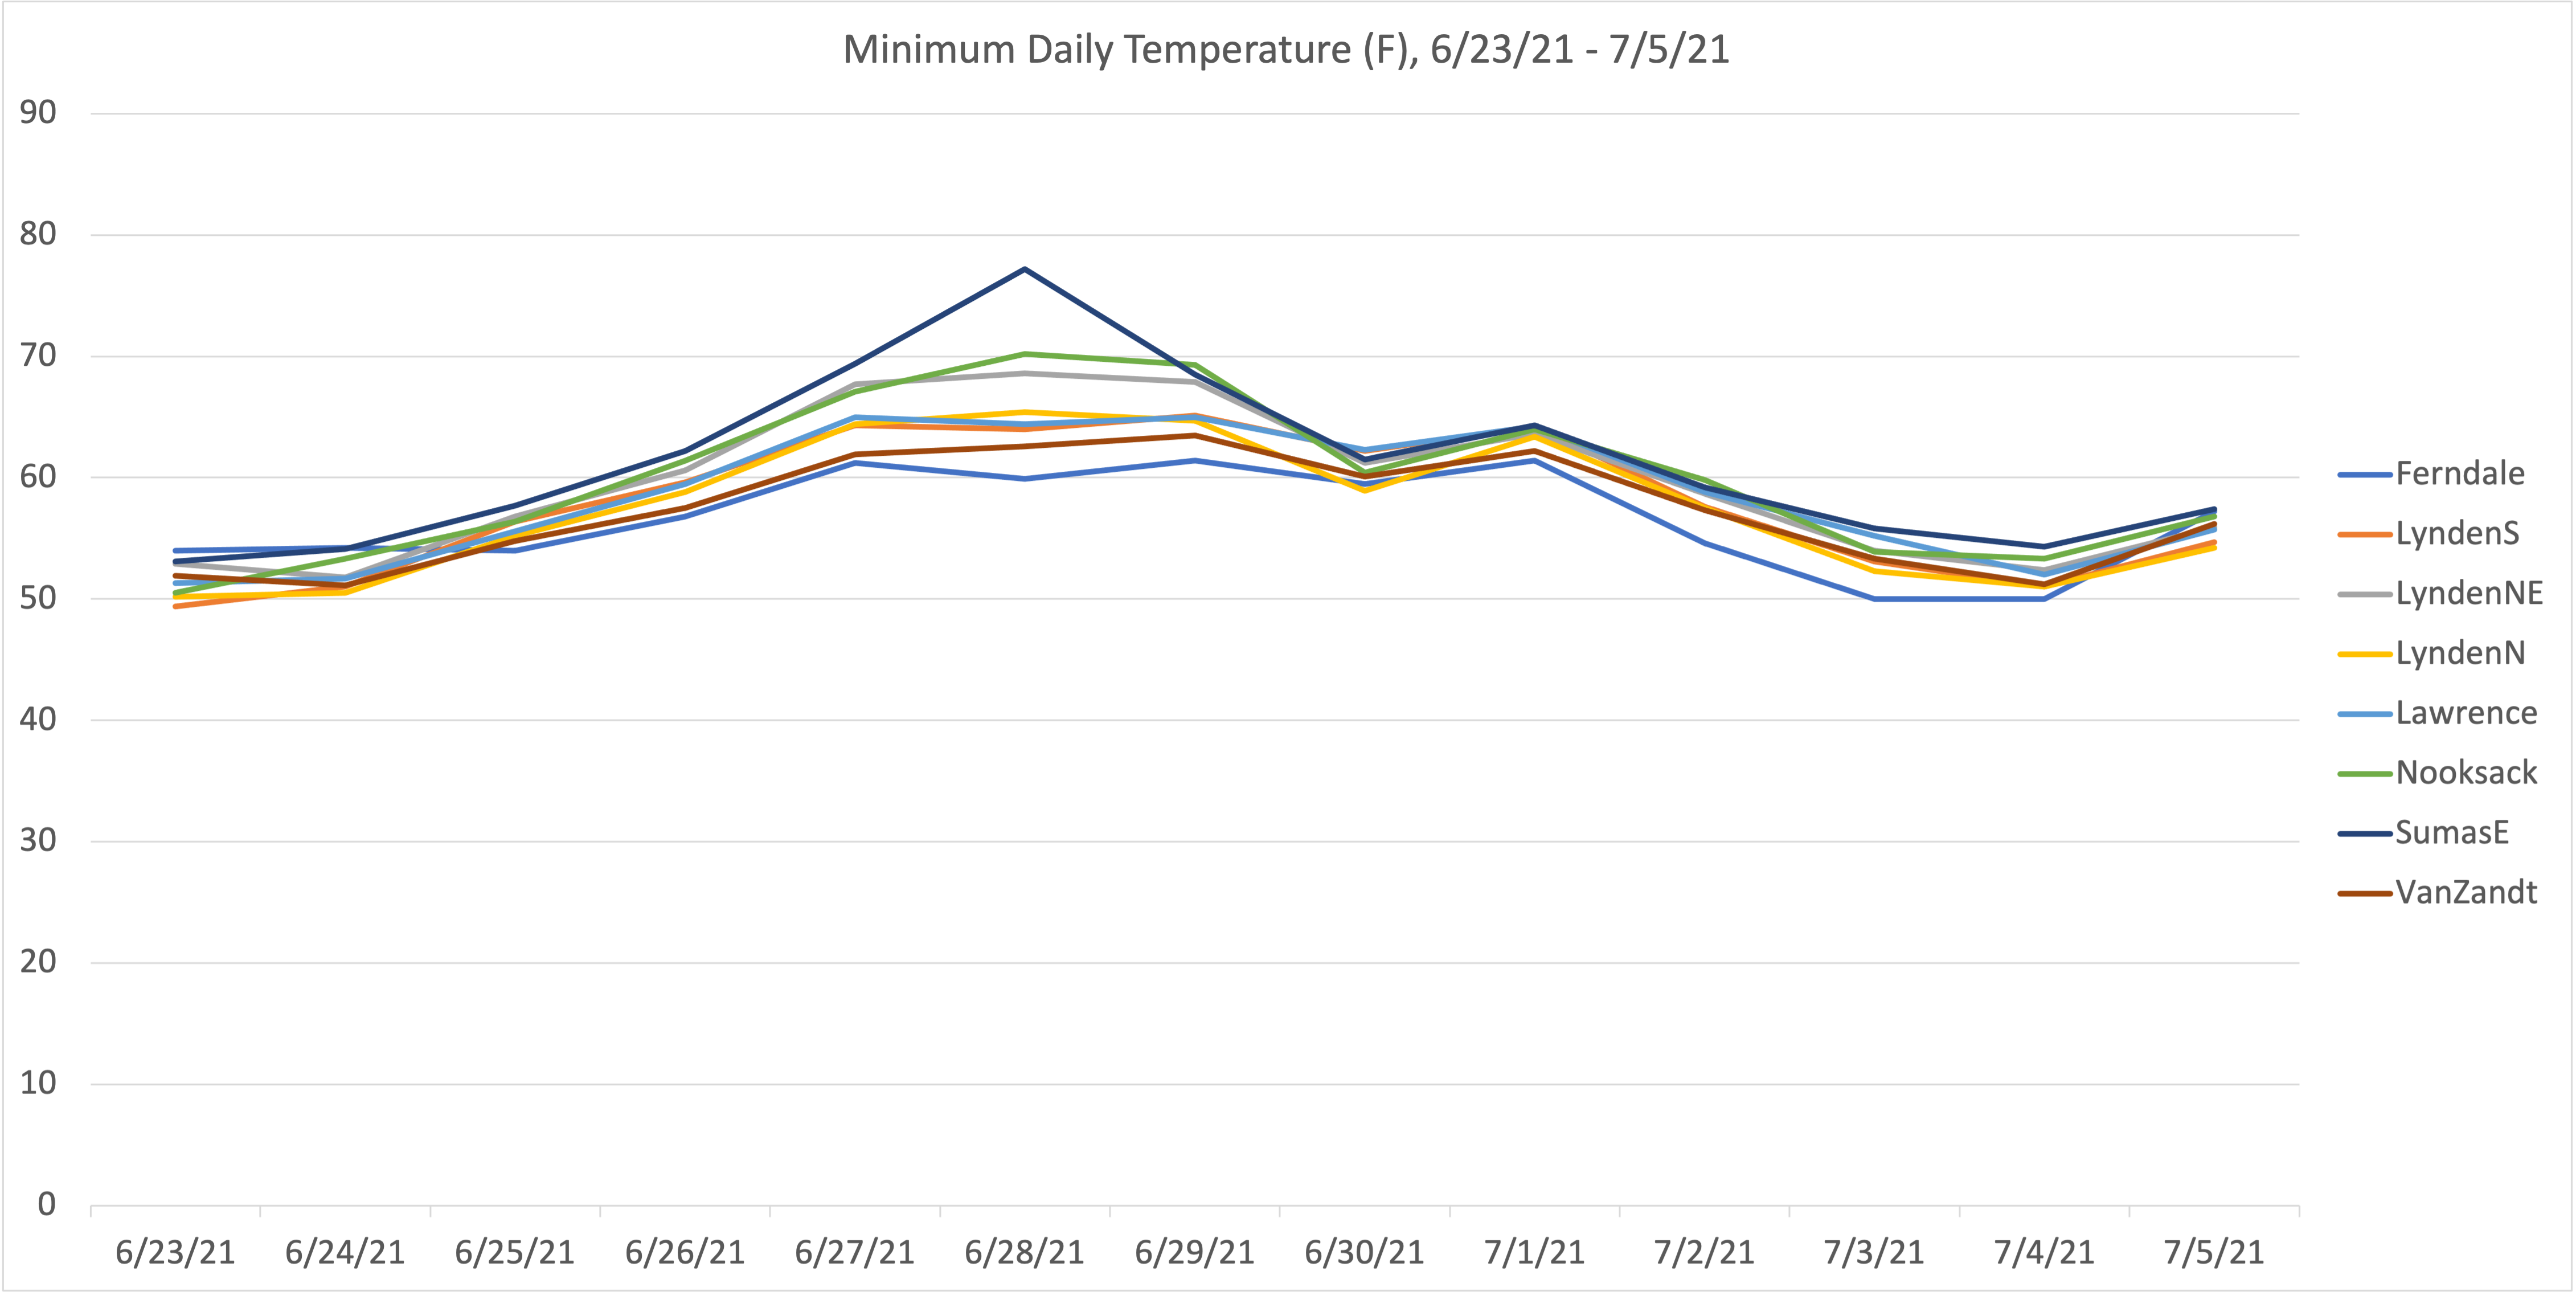
A closer look (Fig. 4) during that time period, the SumasE station maintained the highest minimum temperatures of 62.2 (6/26), 69.4 (6/27), and 77.2 (6/28). On 6/28 there was a 17.3 degree difference between the lowest minimum (Ferndale) and highest minmum (SumasE).
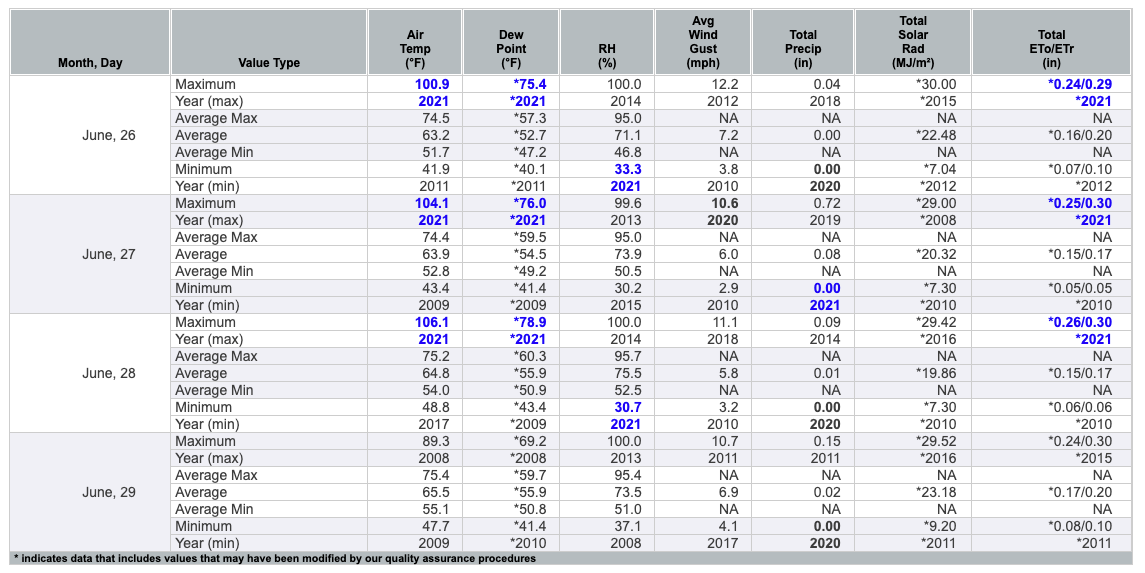
Now, let’s put some historical context on these numbers using the WSU AgWeatherNet stations we will look at the Lawrence station as it has been around the longest (2008). During this 13 year period and only looking at the dates of 6/26-6/29, several records were broken (Fig. 5 in blue). On 6/26, 6/27, and 6/28 maximum air temperature records were all broken. On those same dates, dew point and evapotranspiration levels set new records. Relative humidity levels also reached their lowest levels on 6/26 and 6/28.
The last time this station reached above 100 F was 4807 days ago.
Precipitation
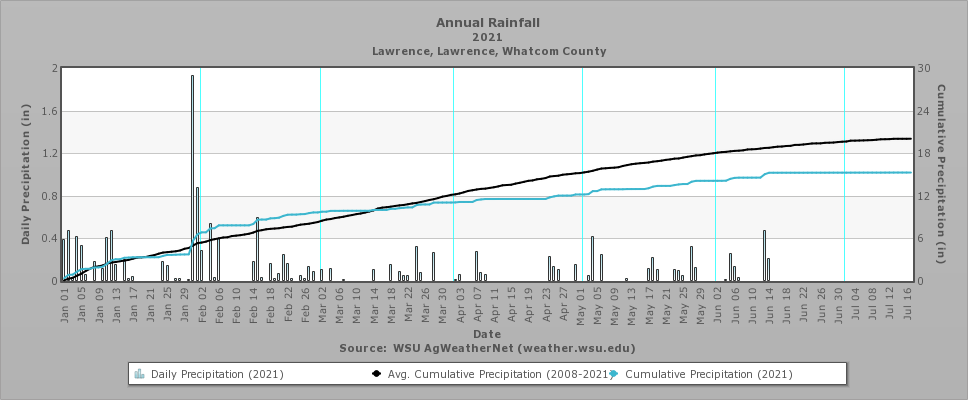
The last measurable rainfall for all stations in Whatcom Count was on June 15, 2021. Using the Lawrence station (Fig. 6) again we are roughly 4.76″ short of this station’s average cumulative precipitation or equivalent to 24% less average cumulative precipitation.
[/textblock][/column][/row]