[row][column][textblock]
Volume 6 Issue 5
Dr. Susan Kerr (kerrs@wsu.edu)[/textblock][/column][/row][row][column][textblock]When it comes to many biological traits that can be inherited, most of us are average (duh), some of us are outstanding, and some of us are real clunkers. Statistically, this is called the normal distribution. When such data is measured and displayed, it has a bell-shaped curve, like this:
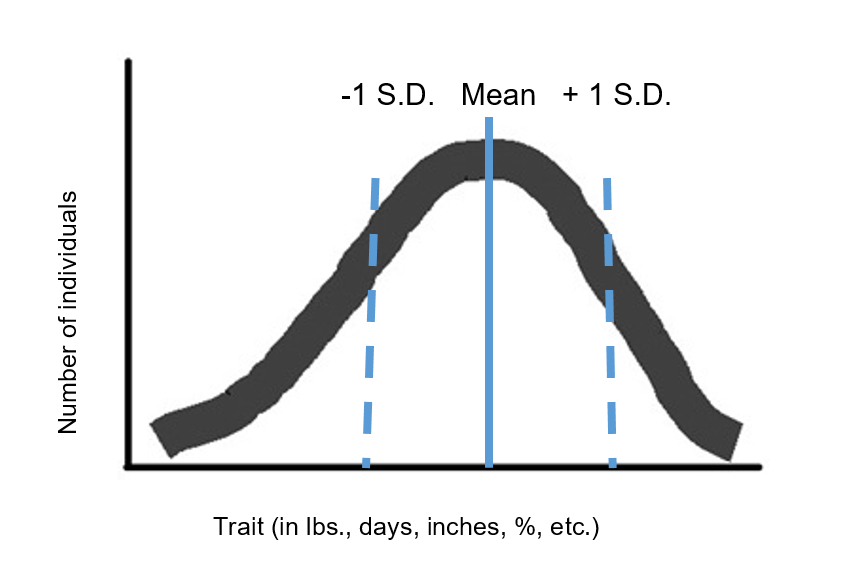
In a normal population with normal distribution of data, about 2/3 of the population will fall within one standard deviation above or below the mean. The rest of the population is well below and well above average. If only we could use this information to identify and select livestock that are outstanding in traits we want to perpetuate for the sake of improved animal health and productive life… Actually, we can and have been doing so for decades.
Estimated Progeny Differences (EPDs) are generated on individuals to compare breeding values and help make breeding decisions. Emphasis is generally placed on sires because an individual sire can have many more offspring than an individual dam. Although EPDs and Estimated Breeding Values are used in the cattle, swine, and sheep industries, for simplicity this article will mostly focus on cattle.
Bull studs (ag businesses that collect, process, and sell semen) collect data on the performance of their sires’ offspring; this data is used to generate EPDs on that sire. The more progeny a sire has, the more accurate the EPDs are. Owners of the females to whom the sires are bred collect all kinds of information and send the data back to the stud farm and/or breed association. Such data collected on cattle include calving ease, birth weight, weaning weight, yearling weight, herd stayability, docility, feet and legs, various carcass traits, and much more. Photo 1 is an example of information provided about an individual sire contained in a bull stud’s catalog.
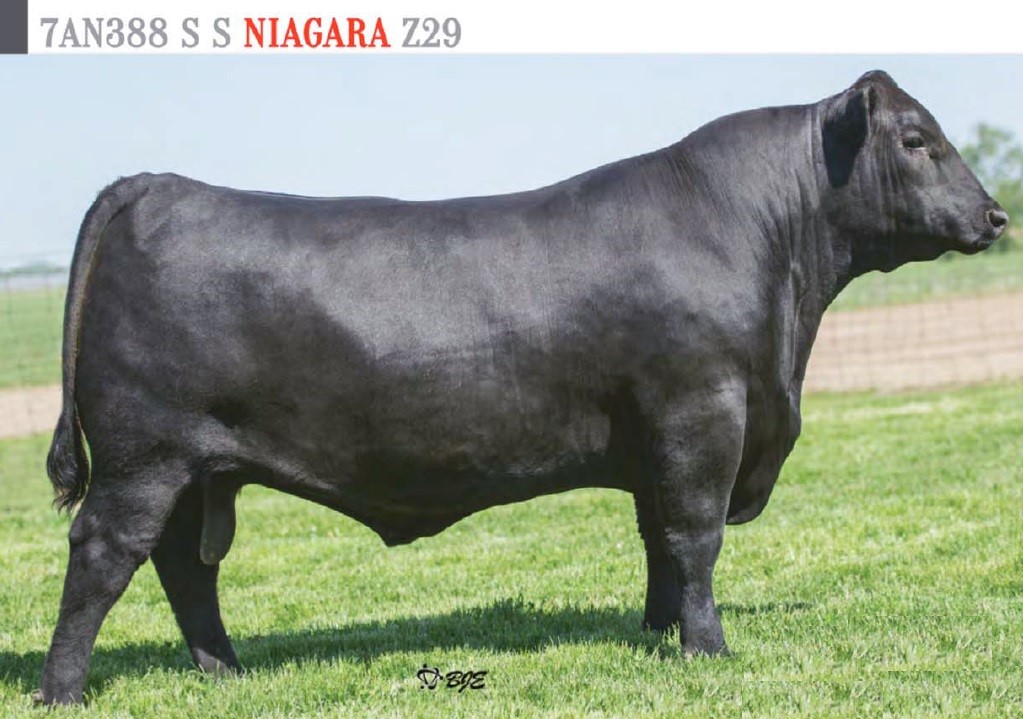
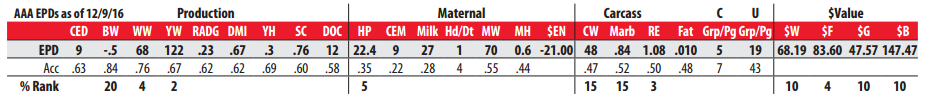
Photo 1. Sire EPD example adapted from Select Sires 2017 beef sire directory, p. 2, www.selectsiresbeef.com/Docs/2017SireDirectory.pdf. Used with permission.
Swine EPDs include pounds of lean, days to 250lbs, feed efficiency, number born alive, number weaned, loin eye area, and many more. Swine EPDs are also grouped into indices with economic weights, which are often used to select breeding animals. These include a terminal sire index, maternal line index, and sow productivity index. The use of an index helps producers make improvements in multiple traits at the same time; selecting for a single trait can make quick and significant gains in that trait, but it is often associated with regression in other desirable traits.
Selecting a new herd sire starts with analyzing the current herd or flock. What are its strengths and weaknesses? Would you like more docile animals? Want to improve milk production? Want more marbling in carcasses? Want to get animals to market weight faster? Need to correct problems with feet or legs? To make genetic improvement, you need to assess where you are and where you want to go, then select breeding animals that will get you there.
One of the many advantages of artificial insemination (AI) is the variety of positive traits you can add to a herd at one time by using multiple sires. For example, you can breed for improved replacement females by breeding your current best females to sires with above-average EPDs for milk production, calving ease, and other maternal traits. At the same time, you could breed other females to sires with outstanding carcass trait EPDs to make gains in carcass quality in market animals.
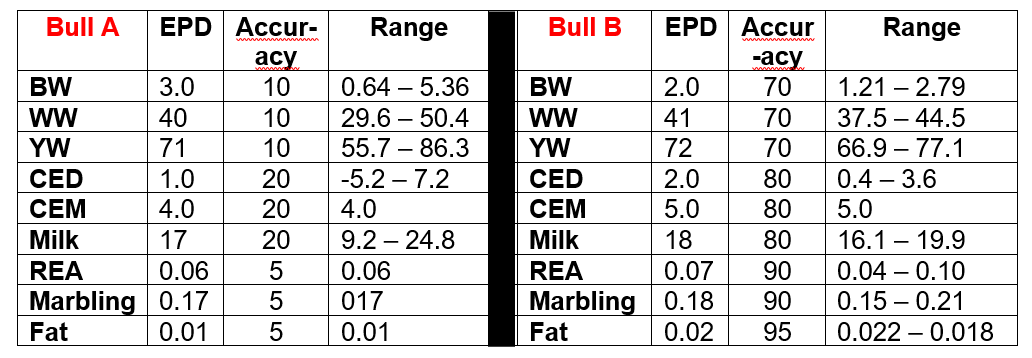
When comparing EPDs between two prospective sires, always consider the accuracy value as well as the EPD itself. Table 1 includes data from two bulls. Bull A’s EPDs for the traits shown have much lower accuracy and wider ranges than Bull B, probably because Bull A has many fewer offspring than Bull B. When it comes to critical traits like birthweight, accuracy is critical: you don’t want to select a bull to breed to heifers and be surprised when some struggle to give birth to above-average birthweight calves.
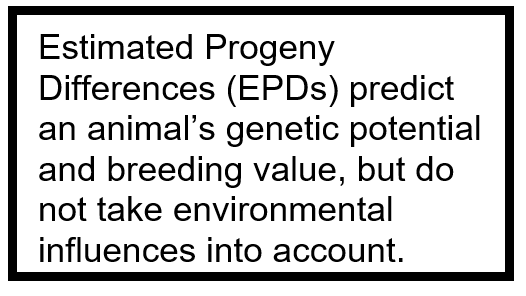
EPDs are a prediction of the breeding value of an animal; they predict probabilities of differences between the offspring of two individuals being compared, or between an individual’s offspring and those of the breed average. Each breed has its own EPDs; EPDs can’t be compared between breeds, even between red and black angus beef cattle. EPDs help predict the genetic potential of an animal and how its offspring are expected to perform without taking environmental or management influences into consideration.
EPD values can be positive or negative. Negative values may be preferable in some situations, such as birth weight EPD when selecting a bull to breed to heifers. However, a negative (below average) yearling weight EPD is not desirable. EPD units are the same as those used for the traits they describe, such as pounds, days, inches, etc. Because EPDs are an estimated genetic value of an individual, they change over time as more information is reported. The value reflects the individual’s records and performance, those of its parents and grandparents, and its offspring.
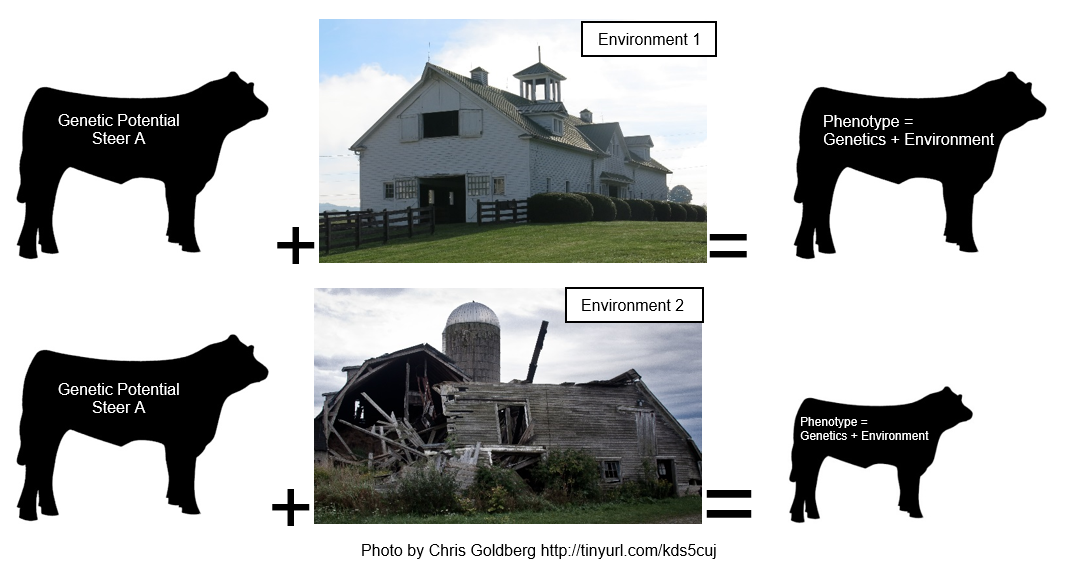
EPDs are generated using statistical models that remove environmental influences and other factors such as management systems, gender, age, etc. However, animal performance ultimately relies on both genetic and environmental factors. As depicted schematically below, an animal with EPDs for a certain level of performance (growth rate, carcass traits, etc.) may or may not live up to its genetic potential if its environment is sub-standard. Nutrition, sanitation, stress, disease prevalence, and so on can result in animals falling well below what they could have achieved under better management.
Genomic marker panels are the next advancement in animal genetic selection. A blood sample or small bit of ear tissue is sent to a commercial laboratory and the owner receives detailed genetic information about that animal. Information is provided in the form of predicted differences in profitability, health, reproduction, carcass traits, etc. This information is very valuable when it comes to retaining replacement females: individuals with the highest genomic scores can be retained and the others can go for other uses or into other markets.
Additional resources
http://extensionpublications.unl.edu/assets/html/g1967/build/g1967.htm
http://nsip.org/nsip-resources-2/estimated-breeding-values/
http://www.apsc.vt.edu/facilities/sheep/flocks/sheep-epds.pdf
http://uknowledge.uky.edu/cgi/viewcontent.cgi?article=1154&context=anr_reports
http://nationalswine.com/seedstockedge/pjc/pjc_terms.php
https://www.pubs.ext.vt.edu/content/dam/pubs_ext_vt_edu/400/400-804/400-804_pdf.pdf
The information herein is supplied for educational or reference purposes only, and with the understanding that no discrimination is intended. Listing of commercial products implies no endorsement by WSU Extension. Criticism of products or equipment not listed is neither implied nor intended.
[/textblock][/column][/row][row][column][textblock][/textblock][/column][/row]