Plant Mineral Nutrition and Fertilizers
Richard T. Koenig, Professor of Soil Science, Department of Crop and Soil Sciences, Washington State University
Teresa C. Koenig, Adjunct Faculty Member, Department of Horticulture, Washington State University
Introduction
Proper nutrition is essential for optimum plant performance. Most homeowners, gardeners, and nursery and landscape professionals recognize the need for timely applications of nutrients to enhance plant growth. Many also understand that different plants have different nutrient requirements. The native or natural fertility level of a soil can supply many of the nutrients plants need, but supplementation with some form of fertilizer (opens in new window) is usually necessary. The challenge is in defining native soil fertility levels and nutrient needs for plants and then selecting the right source and rate of fertilizer to meet those needs.
The task of selecting a nutrient source can be daunting because there are many different commercial inorganic and organic fertilizers on the market, as well as manure, compost, and legume green manure options. To further complicate matters, different fertilizers contain different amounts of plant nutrients, and those nutrients may be released at different rates. In the end, one fertilizer may be better for a specific situation than another, and different fertilizers need to be applied at different rates to supply the correct amount of plant nutrients. Care must also be taken when applying nutrients as overapplication can lead to environmental degradation.
The purpose of this chapter is to describe the role and importance of essential plant nutrients, guide readers in methods used to determine when certain nutrients are deficient, and to provide recommendations on how to select and manage nutrient sources to meet plant needs. This chapter includes balanced information on inorganic and organic approaches to managing fertility. Throughout this chapter the term fertilizer refers to any material used as a source of nutrients for plants.
Essential Plant Nutrients
Seventeen elements are known to be required by plants to complete their life cycle. Three of these—carbon, hydrogen, and oxygen—are obtained from air and water. The remaining 14 are obtained primarily from the soil and are referred to as mineral nutrients (opens in new window). Mineral nutrients used in relatively large quantities are classified as macronutrients and are often divided further into primary and secondary classifications. Primary macronutrients include nitrogen, phosphorus, and potassium, while calcium, magnesium, and sulfur are considered secondary macronutrients. The remaining elements, which are used in much smaller quantities, are considered micronutrients. Table 1 summarizes the 14 essential mineral nutrients and the roles each play in plants.
Table 1. A summary of important characteristics of the 14 essential elements* required by plants.| Element (symbol) | Concentration range in plant | Roles in plant |
|---|---|---|
| Primary macronutrients | ||
| Nitrogen (N) | 1 to 4% | Constituent of amino acids, proteins, and enzymes that control most plant functions; also a component of chlorophyll and DNA; promotes overall growth. |
| Phosphorus (P) | 0.1 to 0.3% | Constituent of DNA molecules and critical energy transfer systems in plants; promotes flowering, seed formation, and maturity. |
| Potassium (K) | 0.5 to 4% | Important in the function of stomatal openings on leaf surfaces, in cell water relations, drought tolerance, and disease resistance. |
| Secondary macronutrients | ||
| Calcium (Ca) | 0.1 to 0.2% | Important in cell wall development of young tissues; enzyme activator. |
| Magnesium (Mg) | 0.05 to 0.15% | Constituent of chlorophyll molecule; necessary for many enzyme reactions. |
| Sulfur (S) | 0.15 to 0.3% | Important constituent of certain amino acids, proteins, and enzymes that control many plant functions. |
| Micronutrients | ||
| Boron (B) | 1 to 10 ppm** | Important in the development and differentiation of growing points in shoot and root. |
| Chlorine (Cl) | 25 to 1,000 ppm | Enhances drought tolerance, stem strength, and disease resistance. |
| Copper (Cu) | 2 to 10 ppm | Essential in many enzyme functions involved in carbohydrate and protein formation. |
| Iron (Fe) | 10 to 75 ppm | Key element in chlorophyll molecule and photosynthesis reactions. |
| Manganese (Mn) | 10 to 20 ppm | Essential in many enzyme functions; chlorophyll synthesis. |
| Molybdenum (Mo) | 0.1 to 0.7 ppm | Required for nitrogen metabolism in plants. |
| Nickel (Ni) | Trace amounts | Involved in enzyme reactions during nitrogen metabolism. |
| Zinc (Zn) | 10 to 30 ppm | Essential in many enzyme functions involved in hormone production and growth and development in plants. |
*Some sources also now cite cobalt (Co) as an essential element.
**ppm = parts per million concentration; ppm ÷ 10,000 = %.
Table 1 summarizes the 14 essential elements required by plants, grouping them into primary macronutrients, secondary macronutrients, and micronutrients, along with their typical concentration ranges in plant tissue and their roles in plant growth and development.
Primary macronutrients include nitrogen, phosphorus, and potassium, which are required in the largest amounts. Nitrogen (1–4%) is a key component of amino acids, proteins, enzymes, chlorophyll, and DNA, making it essential for overall plant growth. Phosphorus (0.1–0.3%) is vital for DNA structure and energy transfer processes, supporting flowering, seed formation, and plant maturity. Potassium (0.5–4%) regulates stomatal function, water balance, drought tolerance, and disease resistance.
Secondary macronutrients—calcium, magnesium, and sulfur—are needed in moderate amounts. Calcium (0.1–0.2%) contributes to cell wall development and acts as an enzyme activator. Magnesium (0.05–0.15%) is a central component of the chlorophyll molecule and is necessary for many enzyme reactions. Sulfur (0.15–0.3%) is an important part of certain amino acids, proteins, and enzymes involved in plant function.
Micronutrients are required in much smaller concentrations, typically measured in parts per million (ppm), but are still essential for plant health. Boron (1–10 ppm) supports the development of growing points in shoots and roots. Chlorine (25–1,000 ppm) enhances drought tolerance, stem strength, and disease resistance. Copper (2–10 ppm) is involved in enzyme functions related to carbohydrate and protein formation. Iron (10–75 ppm) plays a key role in chlorophyll formation and photosynthesis. Manganese (10–20 ppm) supports enzyme activity and chlorophyll synthesis. Molybdenum (0.1–0.7 ppm) is required for nitrogen metabolism. Nickel is needed only in trace amounts and participates in enzyme reactions related to nitrogen metabolism. Zinc (10–30 ppm) is essential for enzyme activity, hormone production, and overall plant growth and development.
Overall, the table highlights that while plants require some nutrients in large quantities and others in trace amounts, all 14 elements are critical for proper physiological function, growth, and reproduction.
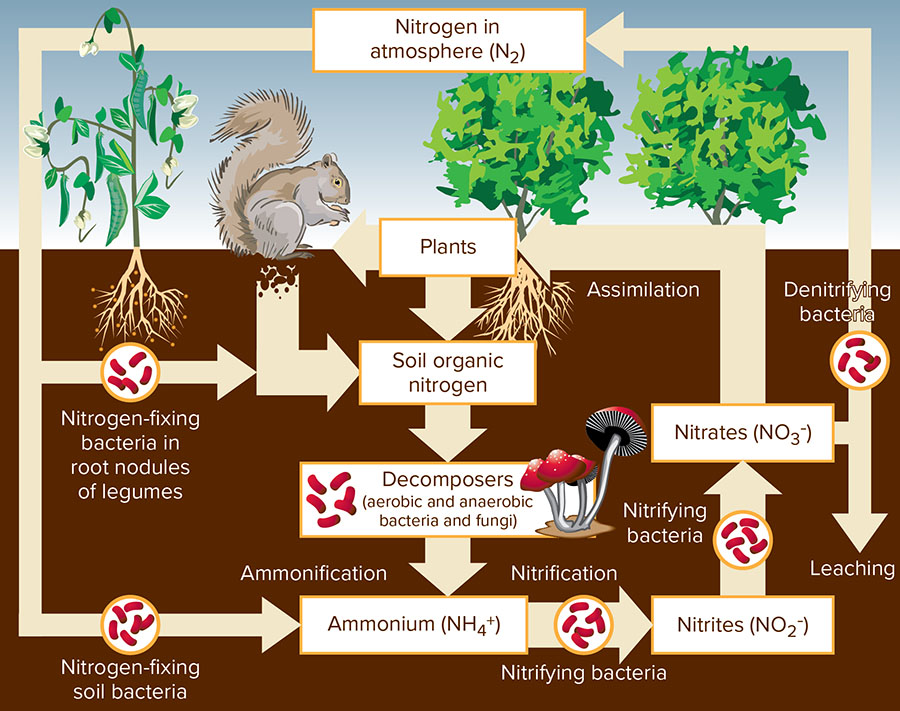
Mineral nutrients cycle through soil and plant systems in complex pathways mediated, in many cases, by diverse groups of microorganisms. Nutrient cycles (opens in new window) describe supplemental inputs such as fertilizer, manure, crop residues, and natural depositions of living and decaying organic matter; transformations between inorganic and organic forms; and outputs such as plant removal, leaching, runoff, and gaseous losses. Figure 1 shows an example of the nitrogen cycle. This is one of the more complex cycles because nitrogen can exist in many different forms in soil, includes many opportunities for transformations by microorganisms, and is subject to many different loss pathways.
Understanding nutrient cycles leads to better nutrient management. For example, applications of compost contribute large amounts of organic nitrogen to soil (Figure 1). This nitrogen must go through the decomposition process (typically called mineralization), mediated by soil microorganisms, before becoming available to plants. Time is required for decomposition to occur, but this is also influenced by soil temperature and moisture. Therefore, organic nitrogen sources are best applied several weeks or months before plant growth. Inorganic (commercially processed) forms of nitrogen are primarily in the ammonium (NH4+) or nitrate (NO3–) forms. Applications of large amounts of inorganic nitrogen can lead to high concentrations of nitrate in the soil and potential leaching losses when rainfall or irrigation is high.
Nutrient Deficiencies
Nitrogen is the most common nutrient deficiency in Washington landscapes and gardens. Phosphorus, potassium, and sulfur deficiencies are also relatively common in Washington. It is more difficult to generalize about the extent of phosphorus, potassium, and sulfur deficiencies since soil can store relatively large reserves from previous applications. Calcium and magnesium deficiencies are encountered mainly in acidic (low pH) soils west of the Cascades. Zinc and iron deficiencies are limited mostly to areas in central Washington with alkaline (high pH) soils. Deficiencies of other nutrients are rarely encountered in Washington. One exception may be acidic soils in western Washington that are limed to increase pH. In some cases, the act of liming can induce deficiencies of micronutrients such as iron, zinc, and manganese.
Nutrient deficiencies can be difficult to diagnose visually. Factors that complicate visual diagnosis include: multiple, simultaneous deficiencies, a similarity in symptoms among certain nutrients, poor or inconsistent expression of the symptom, and similarities with disease and insect symptoms or abiotic stresses (e.g., excess or insufficient soil moisture). Furthermore, plant nutrient deficiency may not be indicative of a deficiency in the soil, such as in the case of moisture stress reducing nutrient movement in the soil and plant uptake. Plants may also suffer from a deficiency without showing visual symptoms, a problem referred to as hidden hunger (opens in new window). Nevertheless, with experience, visual diagnosis can be used to identify nutrient deficiencies. Certain indicator plants can also be used to determine when certain nutrients are deficient, since they tend to show symptoms before other plants (see sidebar Corn: The Indicator Plant).
Various keys exist to aid in visual diagnosis of nutrient deficiencies. Keys guide the reader through the diagnostic process by asking specific questions about the location and nature of the plant symptoms. See sidebar Example Key to Plant Nutrient Deficiencies for more information. Try using the key in situations where you know what the deficiency is to become more familiar with its use.
Corn: The Indicator Plant
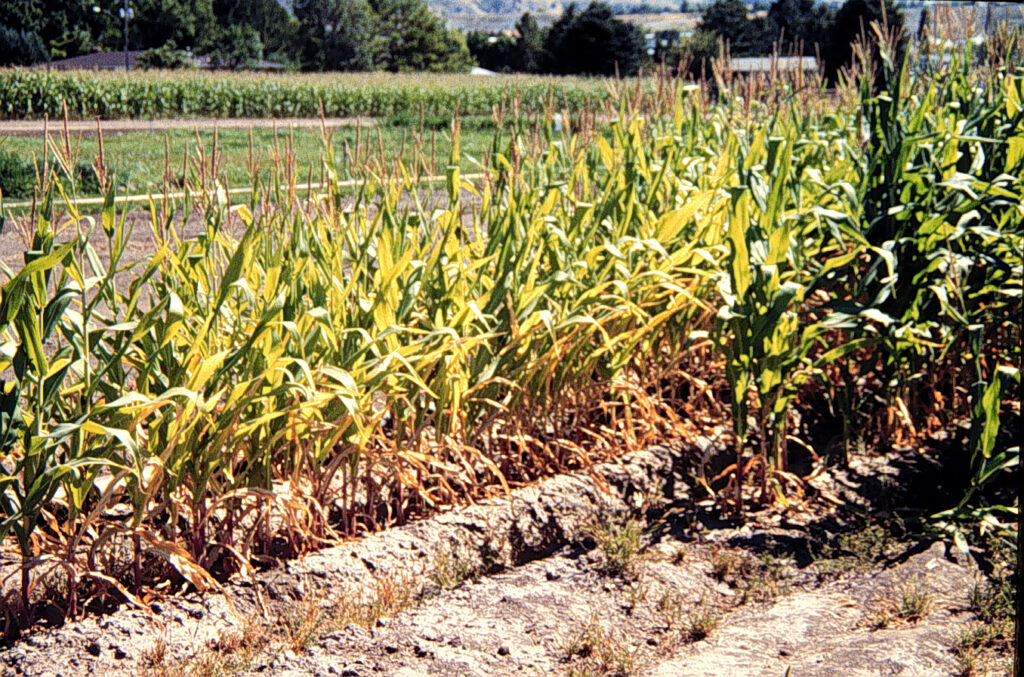
Corn is an excellent indicator plant for nutrient deficiencies. Rapid growth and high nutrient demand mean that corn often expresses deficiency symptoms before other plants in the garden. The large leaves also make nutrient deficiency symptoms in corn easy to identify. Visually inspect corn plants growing in the garden and watch for these symptoms. Adjust the fertility program accordingly when symptoms are seen.
The following images are examples of major nutrient deficiency symptoms for corn:
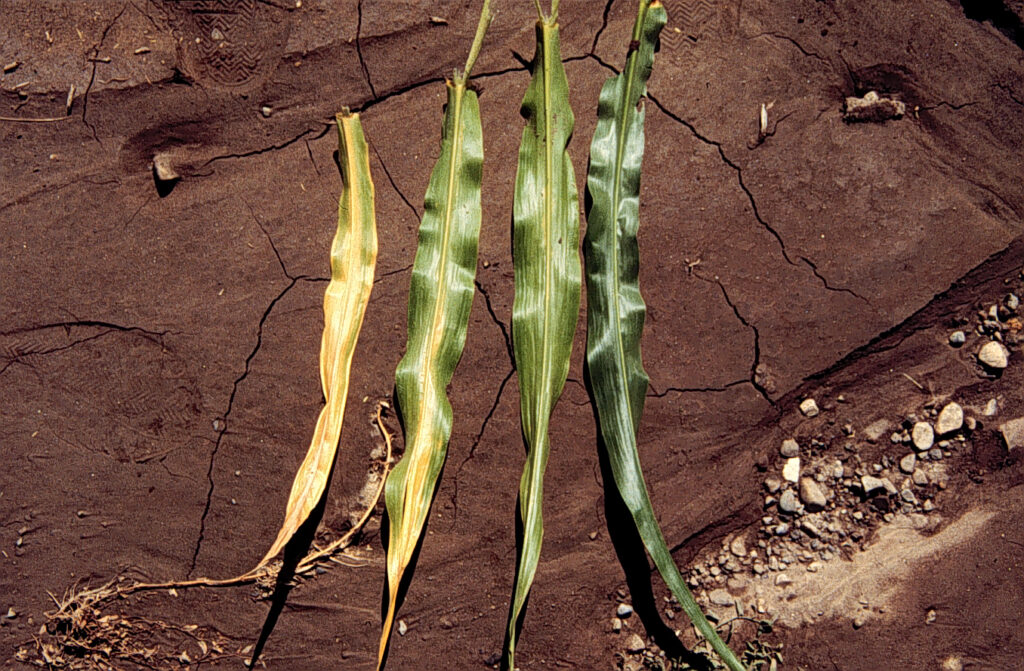
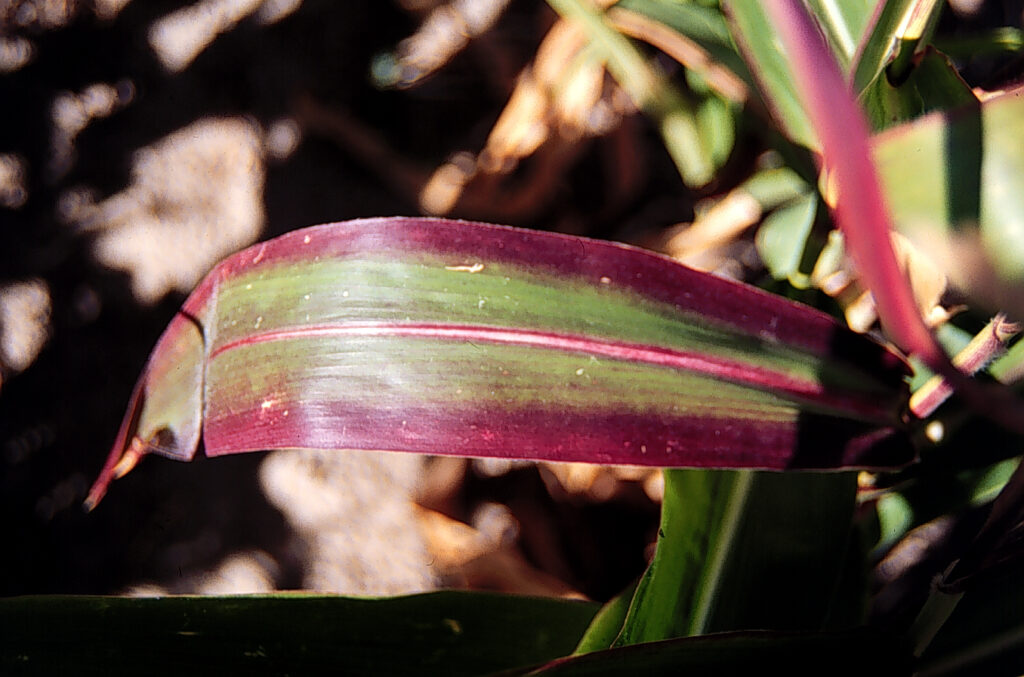
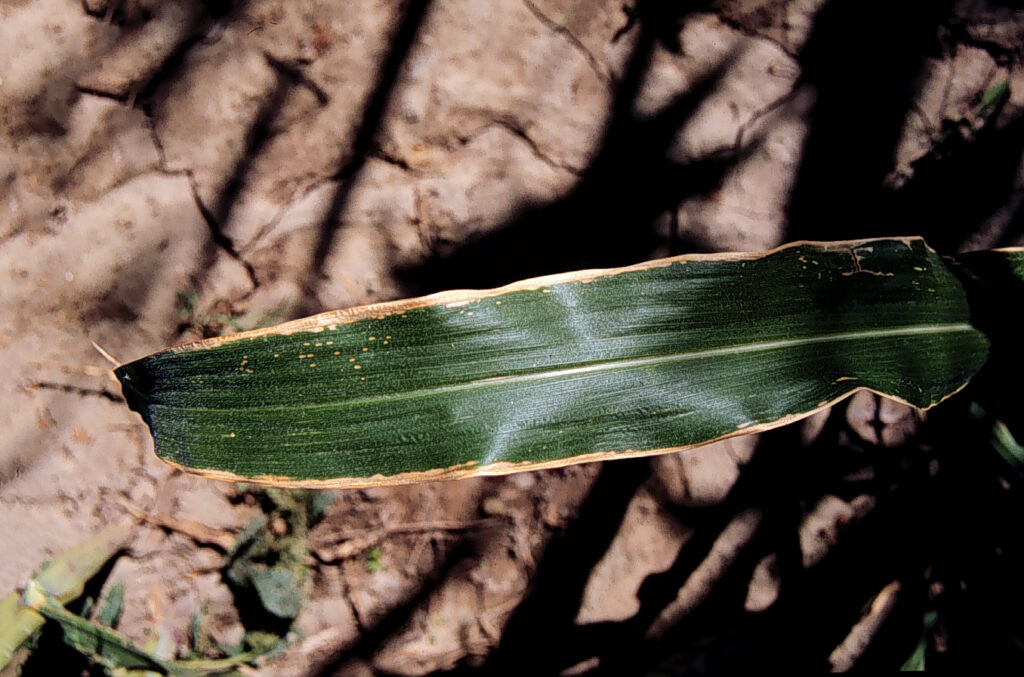
(necrotic) tissue on the outer leaf margins. Photo by R. Koenig.
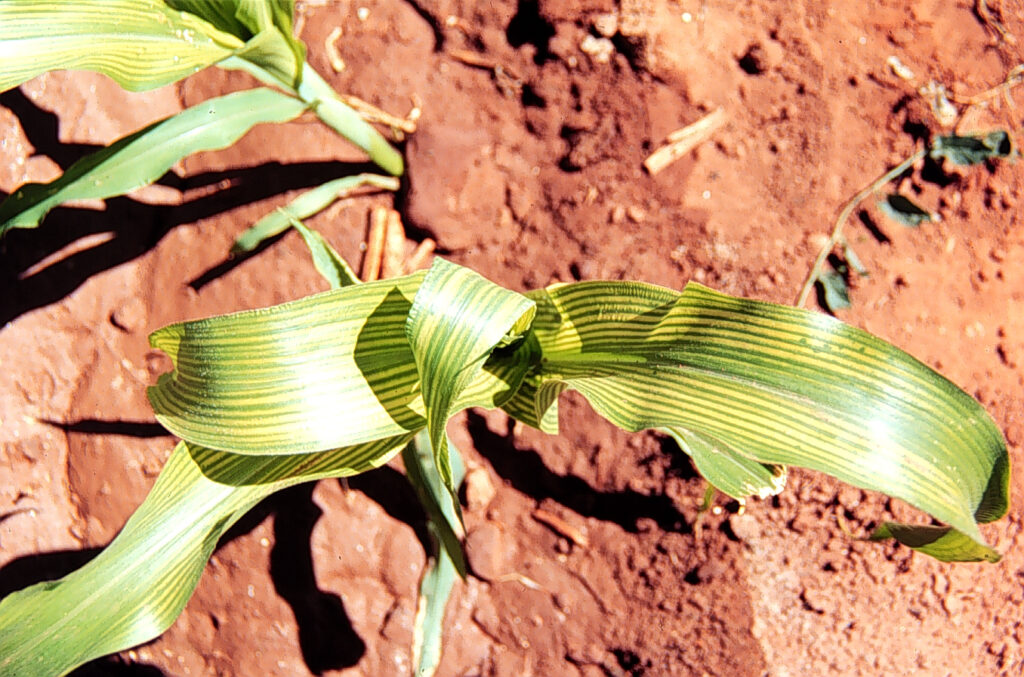
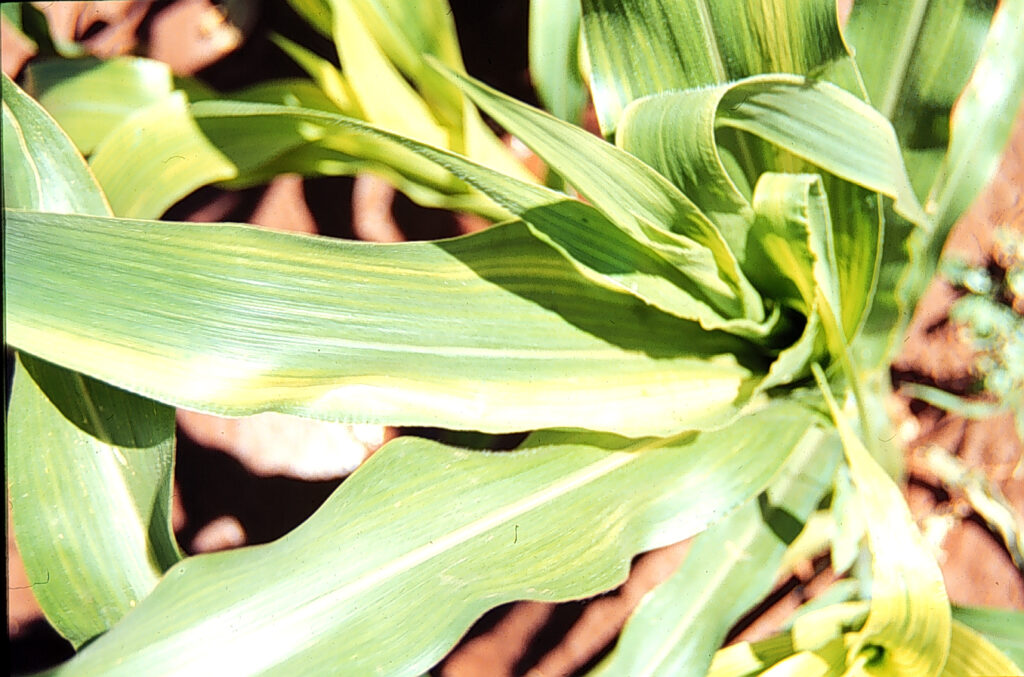
Tissue testing is another way to diagnose nutrient deficiencies; however, tissue testing can cost up to $50 to $75 per sample, and results are not always conclusive. Proper sampling is critical for an accurate tissue test. Specific guidelines are available describing which plant part, and at what stage in the growth cycle, should be sampled. If possible, sample tissues from plants showing deficiency symptoms and from plants that appear healthy, as the comparison of tissue nutrient levels can be as informative as absolute concentrations and thresholds. Refer to the publications listed in the Further Reading section for more information on plant tissue sampling and testing.
Example Key to Plant Nutrient Deficiencies
The key is designed to guide the reader to a plant nutrient deficiency diagnosis.
Read through the symptoms and identify the one that most closely matches the visual symptom.
- Growth reduced; leaves small, on shortened internodes:
- Leaves darker green than normal, often purple — phosphorus
- Leaves normal color; later becoming yellow or streaks of yellow; puckered — zinc
- Growth may be normal, producing average sized plants; leaves may or may not be normal:
- Bud formation affected, or apical growth of shoot and root inhibited:
- Bud formation severely affected; death of root tips — calcium
- Bud formation may be normal but shoot and root tips decay — boron
- Bud formation may appear normal; apical growth may appear normal:
- Younger leaves are darker green than normal; misshaped with necrotic spots — copper
- Leaves yellowing or yellowing and having green vein areas:
- Leaves yellowing only:
- Yellowing first on older leaves:
- Necrotic spots not present — nitrogen
- Necrotic spots on leaf edges common; stems weak — potassium
- Yellowing first associated with younger leaves or with necrotic spots:
- Younger leaves yellow first — sulfur
- Necrotic spots present; leaves may wilt; bronze color — chloride
- Yellowing first on older leaves:
- Leaves yellowing only:
- Leaf yellowing associated with green vein areas:
- Necrotic spots present — manganese
- Necrotic spots not common:
- Symptoms appear in young leaves first — iron
- Symptoms appear in older leaves first:
- Younger leaves often severely twisted — molybdenum
- Younger leaves greener than normal — magnesium
- Bud formation affected, or apical growth of shoot and root inhibited:
Nutrients in Excess
Overapplication of nutrients can have serious environmental consequences. Nutrients that are mobile in soil can be washed or leached through soil and enter groundwater (Figure 1). Surface runoff water may also contain high levels of nutrients or soil particles with nutrients attached which can enter surface water bodies such as lakes and streams. Improper use of any nutrient source—including inorganic (synthetic) fertilizer, organic fertilizer, manures, or composts—can contribute to surface- and groundwater pollution. When used properly, inorganic and organic fertilizers are safe for the environment.
In addition to environmental concerns, excess levels of nutrients impact plant growth in many undesirable ways. Excess nitrogen, for example, results in vigorous vegetative growth but low fruit yield for many garden plants. Tomatoes, pumpkins, and potatoes are excellent examples of plants that, when overfertilized with nitrogen, produce excessively large vines that bear few fruits or tubers. In landscapes, overfertilization of turf produces lush growth that requires more frequent mowing and can be more susceptible to disease. Overfertilization of trees can delay leaf senescence, resulting in limb damage from early season snowfall. Perennials can also be more susceptible to winter damage if overfertilized, since excess nitrogen in late summer or fall will delay natural hardening processes that prepare plants for winter.
Fertilizers as a Source of Nutrients
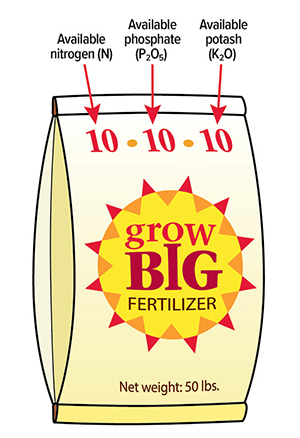
Many different sources of plant nutrients are available, including conventional and controlled release inorganic fertilizers, organic fertilizers and manures, and legumes grown as a green manure crop. Any material sold as a nutrient source is required by law to state the concentrations (in percent of dry weight) of nitrogen-phosphorus-potassium in a prominent location on the label (Figure 2). Phosphorus and potassium are expressed in the oxide forms P2O5 and K2O. This method of expression is a holdover from earlier times when phosphorus and potassium in fertilizers were analyzed after burning the materials to remove any impurities.
A fertilizer label represents a guarantee that the material contains the levels of nutrients stated. If present, concentrations of other nutrients such as calcium, magnesium, sulfur, or zinc are specified elsewhere on the label and serve as a similar guarantee of content.
Some inorganic fertilizers contain a single element. An example is urea, which has the label designation 46-0-0, or 46% nitrogen by weight. Some fertilizers contain all three macronutrients and are called complete fertilizers (opens in new window). The vast majority of inorganic fertilizers are complete fertilizers created to give specific ratios of nitrogen-phosphorus-potassium (Table 2). For example, 25-3-5 is a common lawn food. There are literally hundreds of different inorganic fertilizer blends on the market, and blends containing virtually any combination of nitrogen-phosphorus-potassium can be found.
Table 2. Common fertilizers found in landscape, garden, and farm supply stores.| Name | Fertilizer label % Nitrogen – % Phosphorus (as P2O5) – % Potassium (as K2O) |
|---|---|
| Single nutrient fertilizers | Not applicable |
| Ammonium sulfate | 21-0-0 |
| Urea | 46-0-0 |
| Triple superphosphate | 0-45-0 |
| Potassium chloride | 0-0-60 |
| Multi-nutrient fertilizers | Not applicable |
| Ammonium phosphate | 11-52-0 or 18-46-0 |
| Turf fertilizer | 30-10-0 |
| Complete fertilizers | Not applicable |
| Lawn fertilizer | 29-3-4 |
| Lawn food | 25-3-5 |
| Turf builder | 32-3-2 |
| Starter fertilizer | 20-27-5 |
| Winterizer | 22-4-14 |
| Balanced fertilizer | 16-16-16 |
| Special purpose fertilizers | Not applicable |
| Vegetable food | 12-12-12 |
| Rose food | 20-10-5 |
| Acidic fertilizer | 30-10-10 |
Nutrient concentrations from the label can be used to calculate the amount of nitrogen, phosphorus, and potassium in a given quantity of that fertilizer (see sidebar Example Calculations for Fertilizers).
Table 2 lists common fertilizers available in landscape, garden, and farm supply stores, along with their nutrient compositions as indicated on fertilizer labels. These labels show the percentage of nitrogen, phosphorus (expressed as P₂O₅), and potassium (expressed as K₂O) in each product.
Single nutrient fertilizers provide primarily one essential nutrient. Ammonium sulfate contains 21% nitrogen with no phosphorus or potassium (21-0-0), while urea contains 46% nitrogen (46-0-0). Triple superphosphate supplies phosphorus only (0-45-0), and potassium chloride provides potassium only (0-0-60).
Multi-nutrient fertilizers contain more than one major nutrient. Ammonium phosphate is available in formulations such as 11-52-0 or 18-46-0, supplying both nitrogen and phosphorus. Turf fertilizer, labeled 30-10-0, provides a high proportion of nitrogen with some phosphorus and no potassium.
Complete fertilizers contain all three primary nutrients—nitrogen, phosphorus, and potassium—in varying proportions. Examples include lawn fertilizer (29-3-4), lawn food (25-3-5), and turf builder (32-3-2), which are all higher in nitrogen to promote leafy growth. Starter fertilizer (20-27-5) has elevated phosphorus to support root development, while winterizer (22-4-14) contains more potassium to improve cold tolerance. A balanced fertilizer (16-16-16) provides equal amounts of all three nutrients.
Special purpose fertilizers are formulated for specific plant types or soil conditions. Vegetable food (12-12-12) offers a balanced nutrient ratio for general garden use. Rose food (20-10-5) emphasizes nitrogen for growth and moderate phosphorus for flowering. Acidic fertilizer (30-10-10) is designed for plants that prefer lower soil pH and provides a higher nitrogen content.
Overall, the table explains how fertilizer products differ based on the number and proportion of nutrients they supply, helping users select products suited to specific plant needs and growing conditions.
Overall, the table highlights that while plants require some nutrients in large quantities and others in trace amounts, all 14 elements are critical for proper physiological function, growth, and reproduction.
If sold as a nutrient source, organic fertilizers are subject to the same labeling requirements as inorganic fertilizers. For example, bone meal sold as a nutrient source may have the label designation 6-12-0, or 6% nitrogen and 12% phosphorus (as P2O5) and 0% potassium by weight. The amount of each nutrient in a given weight of organic fertilizer can also be calculated from the nutrient concentrations stated on the label. For example, 10 pounds of 6-12-0 contains 0.6 pounds of nitrogen (10 × 0.06), 1.2 pounds of phosphorus (as P2O5) (10 × 0.12), and no potassium. Different organic materials also tend to have inherent nutrient concentrations and, unlike inorganic fertilizers, specific combinations of nutrients are more difficult to obtain with organic materials. For example, it is difficult to supply sufficient nitrogen without overapplying phosphorus when using animal-derived fertilizers (e.g., manures).
Example Calculations for Fertilizers
Example: Calculating the amount of nitrogen, phosphorus,
and potassium contained in 10 pounds of 25-3-5 fertilizer
This calculation is done by multiplying the decimal equivalent percent (label concentration ÷ 100) of each nutrient in the fertilizer by the quantity of fertilizer. For example, 10 pounds of 25-3-5 fertilizer contains the following:
10 × 0.25 = 2.5 pounds of nitrogen
10 × 0.03 = 0.3 pounds of phosphorus (as P₂O₅)
10 × 0.05 = 0.5 pounds of potassium (as K₂O)
The rest of the material in the fertilizer is
filler and does not supply nutrients.
Organic fertilizers often contain much lower and more variable concentrations of nutrients than inorganic fertilizers. A wide variety of organic materials are available, and many materials available in bulk can serve as nutrient sources (Table 3). Many organic fertilizers also contain other nutrients like sulfur, iron, and zinc; however, concentrations of these are usually not given on the label because levels are either too low or too variable to be specified. In addition to supplying nutrients, regular use of organic fertilizers also increases soil organic matter levels, which improves soil physical properties like water holding capacity, drainage, and tilth (the physical condition of soil related to its structure and the ease of tillage).
Table 3. Average nutrient concentrations and rates of availability for various organic materials.| Material | % Nitrogen | % Phosphorus | % Potassium | Availability* | Notes** |
|---|---|---|---|---|---|
| Alfalfa hay | 2–3 | 0.5–1 | 1–2 | moderate | Not applicable |
| Bone meal | 1–6 | 11–30 | 0 | moderate | alkaline |
| Blood meal | 12 | 1–2 | 0–1 | rapid | acidic |
| Cottonseed meal | 6 | 3 | 1 | slow | acidic |
| Composts | 1–3 | 1–2 | 1–2 | moderate | alkaline |
| Feather meal | 12 | 0 | 0 | moderate | Not applicable |
| Fish meal | 6–12 | 3–7 | 2–5 | rapid | acidic |
| Grass clippings | 1–2 | 0–0.5 | 1–2 | moderate | Not applicable |
| Hoof/horn meal | 12–14 | 1.5–2 | 0 | moderate | alkaline |
| Kelp | 1–1.5 | 0.5–1 | 5–10 | moderate | zinc, iron |
| Leaves | 1 | 0–0.5 | 0–0.5 | slow | Not applicable |
| Legumes | 2–4 | 0–0.5 | 2–3 | moderate | Not applicable |
| Manures: Cattle | 2–3 | 0.5–1 | 1–2 | moderate | weedy |
| Manures: Horse | 1–2 | 0.5–1 | 1–2 | slow | weedy |
| Manures: Swine | 2–3 | 0.5–1 | 1–2 | rapid | Not applicable |
| Manures: Poultry | 3–4 | 1–2 | 1–2 | rapid | high in salts |
| Manures: Sheep | 3–4 | 0.5–1 | 2–3 | moderate | weedy |
| Pine needles | 0.5 | 0 | 1 | slow | acidic |
| Sawdust | 0–1 | 0–0.5 | 0–1 | very slow | ties up nitrogen |
| Sewage sludge | 2–6 | 1–4 | 0–1 | moderate | zinc, iron |
| Seaweed extract | 1 | 2 | 5 | rapid | zinc, iron |
| Straw/corn stalks | 0–0.5 | 0–0.5 | 1 | very slow | ties up nitrogen |
| Wood ashes | 0 | 1–2 | 3–7 | rapid | high in salts |
*Approximate rate that nutrients are released from the material.
**Special properties or characteristics of the material.
Most inorganic fertilizers are highly water soluble and immediately available to plants. This can also cause problems since high solubility will burn plants if materials are overapplied or placed too close to sensitive plants. Soluble materials are also more subject to leaching losses because the majority of the nutrients are available soon after application whereas plant demands extend throughout the entire growing season (Figure 1). Nutrients in most organic fertilizers are much less soluble. This reduces the potential for burning with organic materials, but also results in release rates that are at times difficult to predict and may not match plant demand.
Special Purpose Fertilizers
Some fertilizers have special properties that make them more desirable in certain situations (refer back to Table 2). Acidic fertilizers may be beneficial for acid-loving plants. Special formulations are available for certain plants requiring, for example, higher phosphorus levels for bloom or fruit set. Some nitrogen fertilizers have controlled release properties that meter nitrogen out over several weeks or months. Finally, certain inorganic fertilizers have additives such as herbicides and insecticides. Read and follow label instructions carefully when selecting and using inorganic fertilizers with pesticides. More than one gardener or landscaper has applied a fertilizer with herbicide to gardens or flower beds and damaged or killed desirable plants.
Determining Nutrient Needs
Nutrient needs vary widely depending on soil conditions, previous fertilizer and organic matter additions, and the type of plants grown. The best way to accurately assess nutrient needs is to test the soil (see the Soil Sampling Guidelines sidebar for instructions on collecting the sample and where to finds labs capable of performing the analysis). A soil test from a commercial lab normally costs between $25.00 and $50.00 per sample. Commercial labs are much more accurate than home testing kits. A soil test report will often be accompanied by interpretations and nutrient recommendations for specific conditions. Interpretations and recommendations can also be found in many Extension publications specific to a crop species or plant type. Testing is recommended every two to five years for landscapes and gardens, or more frequently if problems develop. Testing is strongly encouraged for new developments to diagnose and correct problems before installing costly plantings.
Nitrogen is the most common nutrient required in landscapes and gardens. Generally, annual nitrogen needs for different groups of plants and maintenance levels are listed in Table 4. Other chapters provide specific recommendations for different plants. Landscape trees and shrubs, as well as turf, will grow at slower rates if less nitrogen is used than the recommendations listed in Table 4. Slower growth rates may be desirable depending on the goal of the landscaper and the intensity of management. Vegetable nitrogen requirements are designed to produce optimum yields in a garden setting.
Table 4. Annual nitrogen recommendations for landscape and garden plants.| Maintenance level | Recommendation |
|---|---|
| Ornamentals | Not applicable |
| Low: xeriscapes, natural areas | 0 to 1 lb nitrogen/1,000 sq ft |
| Intermediate: standard landscapes | 1 to 2 lb nitrogen/1,000 sq ft |
| High: flower beds, new landscapes | 2 to 4 lb nitrogen/1,000 sq ft |
| Turf* | Not applicable |
| Low: | 0 to 1 lb nitrogen/1,000 sq ft |
| Intermediate: most home lawns | 2 to 3 lb nitrogen/1,000 sq ft |
| High: parks, play fields, golf courses | 4 to 6 lb nitrogen/1,000 sq ft |
| Vegetables, fruits* | Not applicable |
| Low: peas, beans | 0 to 1 lb nitrogen/1,000 sq ft |
| Intermediate: asparagus, beet, carrot, melon, cauliflower, broccoli, brussels sprouts, celery, pepper, tomato, lettuce, radish, spinach, turnip, squash, pumpkins | 2 to 3 lb nitrogen/1,000 sq ft |
| High: berries, onion, sweet corn, potato** | 4 to 6 lb nitrogen/1,000 sq ft |
*Split the total amount of nitrogen into two or more separate applications made over the growing season.
To prevent burning, do not apply more than 1 lb nitrogen/1,000 sq ft in a single application.
**For high maintenance level vegetables, apply one-half of the nitrogen at planting and broadcast or band
(see Application Timing section) the remainder after plants are well established and entering their rapid growth phase.
Table 4 provides annual nitrogen recommendations for landscape and garden plants, organized by plant type and level of maintenance intensity. Recommendations are expressed as pounds of nitrogen per 1,000 square feet per year.
For ornamental plants, nitrogen needs increase with the level of maintenance. Low-maintenance areas, such as xeriscapes and natural landscapes, require 0 to 1 pound of nitrogen per 1,000 square feet annually. Intermediate-maintenance landscapes, such as standard residential plantings, require 1 to 2 pounds per 1,000 square feet. High-maintenance areas, including flower beds and newly established landscapes, require 2 to 4 pounds per 1,000 square feet to support more intensive growth and care.
For turfgrass, nitrogen recommendations also vary by maintenance level. Low-maintenance turf requires 0 to 1 pound per 1,000 square feet. Intermediate-maintenance turf, which includes most home lawns, typically requires 2 to 3 pounds per 1,000 square feet. High-maintenance turf areas, such as parks, athletic fields, and golf courses, require 4 to 6 pounds per 1,000 square feet to maintain dense, actively growing grass.
For vegetables and fruits, nitrogen requirements depend on the crop type. Low-demand crops such as peas and beans require 0 to 1 pound per 1,000 square feet. Intermediate-demand crops—including asparagus, beet, carrot, melon, cauliflower, broccoli, Brussels sprouts, celery, pepper, tomato, lettuce, radish, spinach, turnip, squash, and pumpkins—require 2 to 3 pounds per 1,000 square feet. High-demand crops, such as berries, onion, sweet corn, and potato, require 4 to 6 pounds per 1,000 square feet.
The table also includes important application guidance. The total recommended nitrogen amount should be split into two or more applications over the growing season. To prevent plant injury or fertilizer burn, no more than 1 pound of nitrogen per 1,000 square feet should be applied at one time. For high-maintenance vegetable crops, it is recommended to apply half of the nitrogen at planting and then apply the remaining amount later, either broadcast or banded, once plants are well established and entering a period of rapid growth.
Overall, the table emphasizes that nitrogen needs vary by plant type and management intensity, and that proper timing and application methods are important for effective and safe fertilizer use.
Fertilizer Selection
The wide variety of inorganic and organic fertilizers on the market means a product can be found to meet virtually any need. If a soil test report indicates levels of some nutrients are high or excessive, select products containing lower concentrations of these nutrients since further applications may create an imbalance and adversely affect plant growth or contribute to nutrient loss. For example, if a soil test report recommends only nitrogen, consider using urea (46-0-0), ammonium sulfate (21-0-0; Table 2), or blood meal (12-1-1) or fish meal (6-3-2) (Table 3). If nitrogen and phosphorus are recommended, use a fertilizer such as 30-10-0 or fish meal (6-3-2). Try to select a fertilizer material with approximately the same proportions of nutrients as recommended in the soil test report.
Fertilizers vary considerably in price. The cost of different fertilizers should be compared on a per pound of nutrient basis. Cost per pound depends on the package price, weight, and nutrient concentration in the fertilizer.
For example, if a 36 lb bag of 29-3-4 fertilizer costs $15.88 and a 20 lb bag of 21-0-0 fertilizer costs $2.99, which is the least expensive source of nitrogen? The cost per pound of nitrogen is $1.52 for the 29-3-4 ($15.88 ÷ [0.29 × 36]) and $0.71 for the 21-0-0 ($2.99 ÷ [0.21 × 20]). More expensive fertilizers often contain additives for pest control and may have added micronutrients or slow-release characteristics. Compare prices among products and purchase fertilizers with special additives only if they are needed. Bulk quantities of organic materials are generally less expensive than small packages.
Calculating Application Rates
Nutrient recommendations for landscapes and gardens are commonly expressed in pounds per 1,000 square feet (See the Example Fertilizer Calculation sidebar #2). Extension bulletins and most labs performing soil test analyses for landscapes and gardens also express recommendations in this form. The information required to calculate the amount of a fertilizer material needed is the nutrient recommendation, the concentration of nutrient in the fertilizer material, and the size of the area to be fertilized. See the Example Fertilizer Calculation sidebars and the More Examples of Fertilizer Calculations sidebar for fertilizer rate calculations.
Once the amount of fertilizer is calculated, weigh out or carefully estimate the weight of fertilizer needed for the area. A useful approximation is one pint (two cups) of dry inorganic fertilizer to one pound weight. Fertilizer labels also contain general guidelines for application rates in different situations. Always read the label on products before using them.
Fertilizer Application Methods
Mineral nutrients are absorbed primarily through the root system, though small quantities can be applied as foliar sprays and absorbed through the leaves. Fertilizers are commonly broadcast on the surface and tilled or watered into soil. A common fertilizer spreader can be used to apply either inorganic or organic fertilizers. Organic materials may need screening before spreading to remove large particles and facilitate more uniform applications.
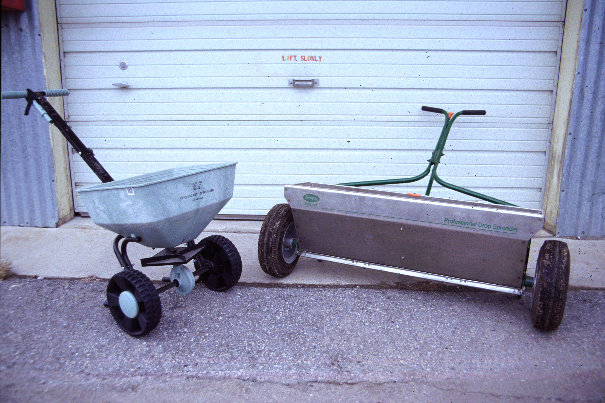
Two main types of broadcast applicators are the drop spreader and the rotary spreader (Figure 3). Most drop spreaders are capable of applying a wide range of rates; however, the path spread is limited to the width of the unit (normally 18 inches to 3 feet). Rotary spreaders may broadcast material in a 5- to 10-foot-wide path but with less uniformity and rate control than drop spreaders. Most spreaders are adjustable for different fertilizer materials and rates of application. The spreader manufacturer normally supplies calibration settings for various rates of inorganic fertilizers. Spreaders need to be calibrated for organic materials.
To calibrate a spreader with an organic material, adjust the spreader to a relatively high setting. Place two or three pounds of organic material in the hopper and proceed to spread this amount in a continuous straight path. Note the width of the spread path and the distance traveled to broadcast all of the material. Calculate the area of coverage by multiplying width by length. Calculate the rate of application in pounds per 1,000 square feet by dividing the pounds of fertilizer spread by the area covered and multiplying by 1,000. Compare this value to the rate needed.
Soil Sampling Guidelines
An important first step in testing garden and landscape soils is to collect a representative sample. Areas that have been treated differently should be sampled separately. For example, gardens should be sampled separately from lawn areas. Avoid unusual or problem areas, or sample them separately to define the problem.
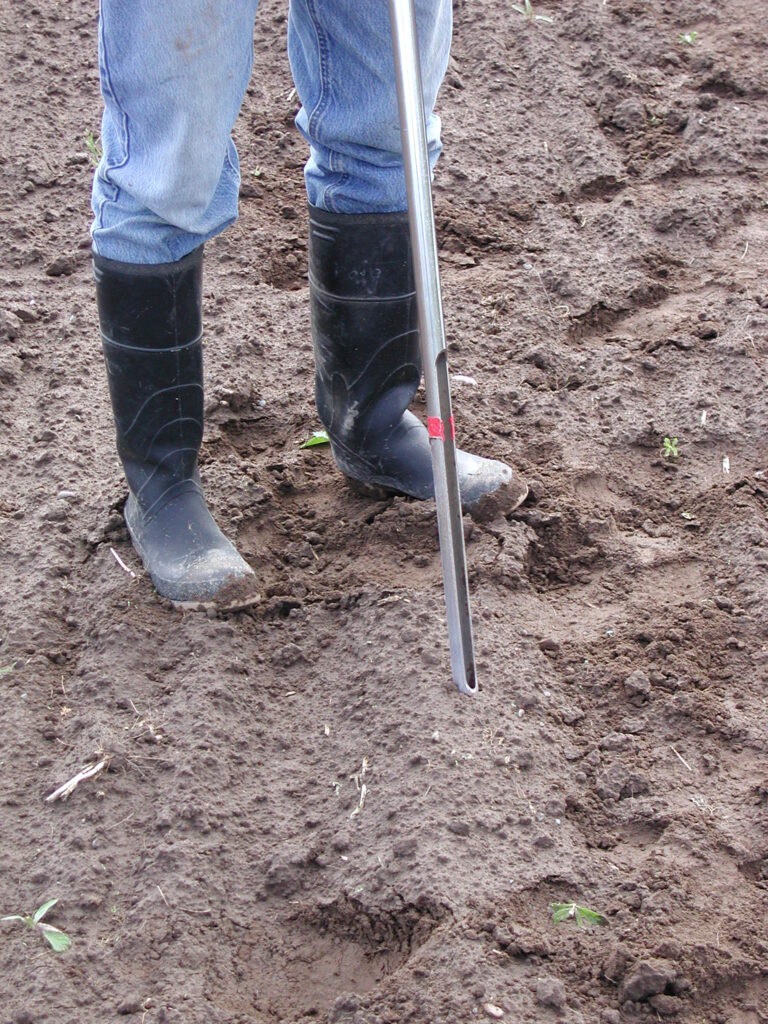
Collect samples from the surface to a depth of 12 inches or to the depth of rooting activity. In disturbed or tilled areas, a shovel works well to collect samples, though care should be taken to sample a consistent soil volume throughout the 12-inch depth. A hollow-tube soil probe is easier to use when sampling lawns or around perennial vegetation.
Collect a minimum of five samples from different locations in the area and mix them together in a clean bucket. Air-dry the soil and transfer approximately one pint to a separate container or plastic bag to mail the sample to the lab. If multiple samples are submitted for analysis, label each so that the area from which they were taken can easily be identified.
Several labs in Washington conduct soil analyses. See the website Analytical Laboratories and Consultants Serving Agriculture in the Pacific Northwest referenced at the end of this chapter for contact information for these labs. Look up the lab on the internet for specific information about testing packages they offer and associated costs. In addition, it is important to stick with the same lab or analytical process year after year so that comparisons between sampling times are consistent.
Example: Calibrating a Broadcast Spreader
If a spreader broadcasts a 5-foot-wide path and traveled
20 feet to empty 3 pounds of compost, calculate the application
rate in pounds per 1,000 square feet. The area covered is
5 ft × 20 ft = 100 sq ft. The rate of application is:
(3 lb ÷ 100 sq ft) × 1,000 sq ft = 30 lb per 1,000 sq ft.
Compare this to the rate of compost needed, and,
if necessary, adjust the spreader and calibrate again.
Due to their relatively low nutrient content, organic fertilizers are applied at much higher rates than inorganic fertilizers. Therefore, even at the highest spreader settings you may have to make two or more passes over an area to apply the required amount of material. Once a spreader is calibrated for a specific rate of organic fertilizer, keep a record of the setting for future use with this material. Be consistent in the walking speed when applying fertilizers during calibration and application.
When applying fertilizer, avoid streaking caused by skips and overlap by applying one-half of the fertilizer while traveling in one direction and the other half while traveling in a perpendicular direction. This method of application is especially important for fertilizing turf where streaking is common. An alternative method of broadcasting large quantities of organic material is to space piles of the material throughout the area and spread the piles out uniformly using a garden or leaf rake.
Banding (opens in new window) is a convenient way to make in-season applications to high nitrogen requiring vegetables like corn (Table 4). Banding also works well to apply immobile nutrients like phosphorus near plant roots. If banding an organic fertilizer, select a material with rapid nutrient release (Table 3).
Example Fertilizer Calculation #1
Situation: 30-10-0 will be used to fertilize a garden at the rate of 2 pounds of nitrogen per 1,000 sq ft. The garden area is 10 feet wide by 50 feet long. How much 30-10-0 is needed to fertilize this area at the desired nitrogen rate?
Step 1: Calculate how much 30-10-0
is required to fertilize 1,000 sq ft at
2 pounds of nitrogen per 1,000 sq ft.
Divide the amount of nitrogen required
in 1,000 sq ft by the decimal equivalent
of nitrogen in the fertilizer
(30% ÷ 100 = 0.30):
2 pounds of nitrogen ÷ 0.30 =
6.7 pounds of 30-10-0 per 1,000 sq ft
Step 2: Calculate the area to be fertilized by multiplying the length
by the width (in feet):
50 feet long × 10 feet wide =
500 sq ft area
Step 3: Divide the area to be fertilized (Step 2, above) by 1,000 sq ft and multiply by the amount of fertilizer calculated in Step 1:
(500 sq ft ÷ 1,000 sq ft) × 6.7 =
3.4 pounds of 30-10-0
Answer: A total of 3.4 pounds of
30-10-0 is necessary to fertilize the 10
by 50 foot garden area at a rate of
2 pounds of nitrogen per 1,000 sq ft.
Example Fertilizer Calculation #2
Situation: 0-45-0 will be used to fertilize a lawn at the rate of 1 pound of phosphorus (as P2O5) per 1,000 sq ft. The lawn area is 50 feet wide by 100 feet long. Calculate how much 0-45-0 is needed to fertilize this area at the desired phosphorus rate.
Step 1: Calculate how much 0-45-0 is required to fertilize 1,000 sq ft at 1 pound of phosphorus per 1,000 sq ft. To do this, divide the amount of phosphorus required in 1,000 sq ft by the decimal equivalent of phosphorus in the fertilizer (45% ÷ 100 = 0.45):
1 pound of phosphorus ÷ 0.45 =
2.2 pounds of 0-45-0 per 1,000 sq ft
Step 2: Calculate the area to be fertilized by multiplying the width
by the length (in feet):
50 feet wide × 100 feet long =
5,000 square foot area
Step 3: Divide the area to be fertilized (Step 2, above) by 1,000 sq ft and multiply by the amount of fertilizer calculated in Step 1:
(5,000 sq ft ÷ 1,000 sq ft) × 2.2 =
11 pounds of 0-45-0
Answer: A total of 11 pounds of
0-45-0 is necessary to fertilize the
50 by 100 foot lawn at a rate of
1 pound of phosphorus per 1,000 sq ft.
Example Fertilizer Calculation #3
Situation: Blood meal (12-2-1) will be used to fertilize a garden at the rate of 2 pounds of nitrogen per 1,000 sq ft. The garden area is 20 feet wide by 100 feet long. Calculate how much 12-2-1 blood meal is needed to fertilize this area at the desired nitrogen rate.
Step 1: Calculate how much 12-2-1
is required to fertilize 1,000 sq ft at
2 pounds of nitrogen per 1,000 sq ft.
To do this, divide the amount of nitrogen required in 1,000 sq ft by the decimal equivalent of nitrogen in the fertilizer (12% ÷ 100 = 0.12):
2 pounds of nitrogen ÷ 0.12 =
16.7 pounds of 12-2-1 per 1,000 sq ft
Step 2: Calculate the area to be fertilized by multiplying the width
by the length (in feet):
20 feet wide × 100 feet long =
2,000 sq ft area
Step 3: Divide the area to be fertilized (Step 2, above) by 1,000 sq ft and multiply by the amount of fertilizer calculated in Step 1:
(2,000 sq ft ÷ 1,000 sq ft) × 16.7 =
33.4 pounds of 12-2-1
Answer: A total of 33.4 pounds
of 12-2-1 blood meal is necessary
to fertilize the 20 by 100 foot
garden area at a rate of 2 pounds
of nitrogen per 1,000 sq ft
To band a fertilizer, first calculate the amount of material needed for the area as if you were going to broadcast the material. Divide this amount by the number of plant rows in the area to determine the amount of fertilizer to apply for each row. Open narrow furrows six to eight inches away from the base of the plants, two to three inches deep. Distribute the fertilizer evenly in the furrow, cover the band with soil, and water.
Liquid and foliar fertilizer applications can be made with water-soluble inorganic products and materials such as fish emulsion or seaweed extract. There is a potential for leaf burning with foliar applications, so follow product label instructions carefully. A “tea” of manure or compost can also be used as a source of liquid fertilizer. Partially fill a burlap or cloth bag with manure or compost and submerge for several days in a bucket of water exposed to the sun. The resulting “tea” can be applied directly to the soil or foliage of plants.
Application Timing
Timing nutrient applications to meet plant demand is important—both for plant performance and to reduce the potential for nutrient losses from soil. Unless the label states that the material has slow-release properties, nutrients in inorganic fertilizers are available within a few days of application. Organic fertilizers generally release nutrients slower than inorganic materials, and release rates vary among different organic materials (Table 3). Release of nutrients from organic sources is also dependent on soil microorganisms, which are more active during warm periods and when soil moisture is adequate.
Inorganic fertilizers are normally applied in the spring prior to planting or when growth initiates in perennials. Organic fertilizers often need to be applied earlier than inorganics, such as the fall before a spring planting. Generally, the slower the nutrient release rate from organic materials, the earlier these materials need to be applied prior to plant needs. For slow-growing plants and xeriscapes fertilized with low rates of nitrogen (Table 2), a slow to moderate availability organic material can be used. Organic materials with very slow nutrient availability, while good sources of organic matter, generally make poor sources of nutrients for plants needing nitrogen early in the growing season.
For plants with high nitrogen requirements like corn, potatoes, and intermediate- to high-maintenance turf (Table 4), split applications of a soluble inorganic fertilizer or rapidly available organic material are recommended. A portion (25–50%) of the annual nitrogen requirement is usually applied at planting or early in the spring. The remainder is split into two to three applications made during the growing season. If organic nutrient sources are used to fertilize high nitrogen demand plants, select materials that release nutrients rapidly for best performance (Table 3).
Often, combined approaches where nutrients from organic materials are supplemented with more soluble inorganic fertilizers can allow gardeners and landscapers to capture the benefits of both. The organic material provides a slow but continuous supply of nutrients while inorganic materials can be added at appropriate times, such as during the rapid growth phase of high nutrient demand garden crops.
Soil pH
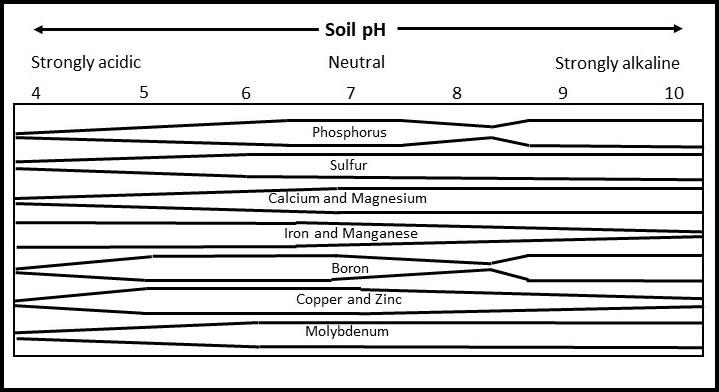
Soil pH influences nutrient availability, toxicity, and microbial activity. In most cases, pH does not influence the total amount of a nutrient in soil, only the chemical form in which nutrients are present (Figure 4). However, for many nutrients, it is the chemical form and not the total amount in soil that influences availability to plants.
Fortunately, most plants grow well in soil at a pH range of 5.5 to 7.5. A few acid-loving plants require lower soil pHs (acidic soils), while some native plants from arid desert environments appear to require higher soil pH (alkaline) conditions.
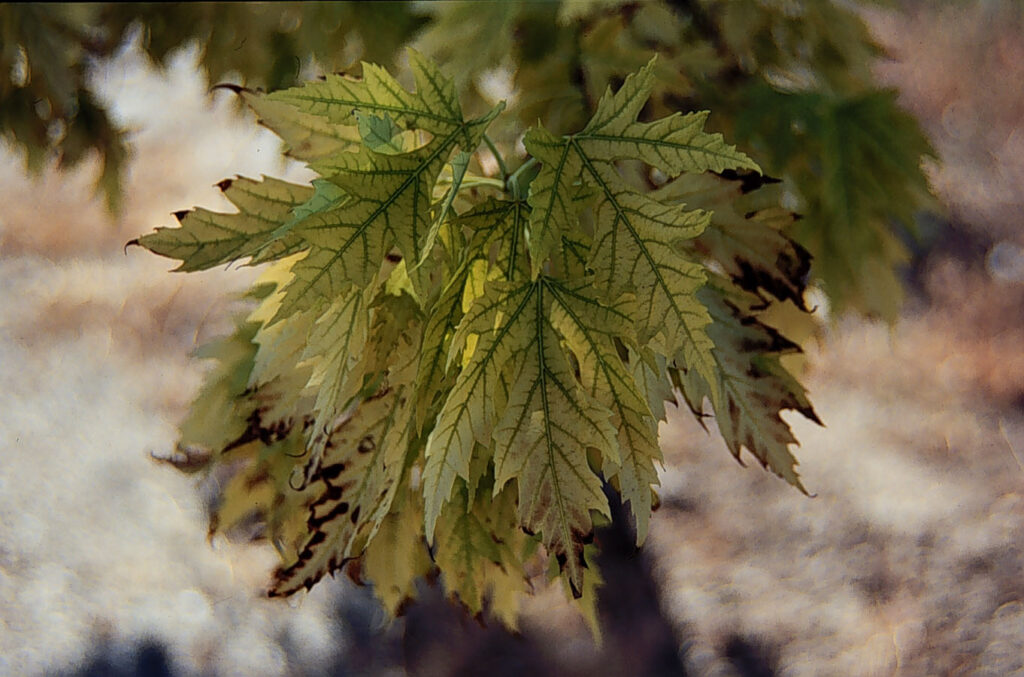
Plants grown in soil with a pH outside of their adapted zone frequently suffer nutrient deficiency or toxicity symptoms. One example of a pH-induced nutrient deficiency is iron chlorosis, a yellowing of leaves on certain ornamental trees, shrubs, and small fruits (Figure 5). This problem commonly occurs when plants adapted to acidic soil conditions are grown in alkaline soils. pH-induced nutrient deficiencies can be difficult to control, since fertilizer applications made to address the deficiency can be rapidly rendered unavailable in the soil unless the underlying problem of soil pH is addressed.
Raising Soil pH
Soil pH is raised by adding lime. Ground limestone is a white powdered material composed primarily of calcium carbonate. Dolomitic lime is composed of calcium and magnesium carbonates. Lime materials react in soil to neutralize excess acidity. In the reaction, calcium and (if dolomite is used) magnesium are released. Lime can be an important source of these nutrients since they are commonly deficient in soils with low (acidic) pH.
Wood ashes are a readily available source of potassium, calcium, and magnesium. Like lime, they also raise soil pH. However, high rates of wood ashes may cause short-term salt injury, so apply less than 15 to 25 pounds per 1,000 square feet. Wood ashes are not recommended for use in alkaline soils.
A simple and inexpensive home test kit available at many landscape and garden supply stores can be used to determine soil pH. A more elaborate test called a lime requirement can indicate exactly how much lime is required to increase soil to a specific pH. Once soil pH is known, a decision can be made whether or not to apply lime based on the plants being grown. Generally, most areas needing lime will be located west of the Cascades or in areas with a long history of applying acidifying fertilizers.
If requested, a soil test will include a lime application rate. An average application rate is approximately 50 lb of lime per 1,000 square feet. Lime should be tilled into soil if possible. Lime is a slow-release material, so apply it in the fall to benefit spring crops.
Lowering Soil pH
If soil pH is above 8.0 or more and acid-loving plants are desired in alkaline soil, some action can be taken to reduce pH. Peat and sphagnum peat moss are acidic and will lower soil pH more than other organic amendments. Elemental sulfur (90 or 99% sulfur on the label) oxidizes slowly in the soil to form acid. Applications at rates of 2 to 4 pounds per 1,000 square feet of area can reduce pH.
Test the soil regularly and stop adding sulfur when pH has reached desirable levels. Acidifying fertilizers such as ammonium sulfate and other products labeled as such can also lower pH. Finally, planting on raised beds in a sandy medium amended with peat moss or another source of acidic organic matter and elemental sulfur can create acidic areas for specialty plants.
Further Reading
Washington State Pest Management Resource Service (opens in new window). n.d. Analytical Laboratories and Consultants Serving Agriculture in the Pacific Northwest. Washington State University.
Stell, E. 1998. Secrets to Great Soil. Storey Communications, Inc., 224 pp.
Western Plant Health Association. The Western Fertilizer Handbook, 10th edition (published 2022), and the Western Fertilizer Handbook: 3rd Horticulture Edition (published in 2012). Waveland Press. Both of these handbooks are available online at reasonable prices.
Most university Extension publication collections have a wide variety of bulletins relating to soil fertility, fertilizers, and plant nutrition. Search your local university’s online publications library or the WSU Extension publication library (opens in new window).